

A note before you read: the write-up below is an AI-generated summary of the live, built from the transcript. I’ve checked it, but if anything reads differently from what I said on camera, the video is the source of truth.
This is the third Live with Sam Kovacs, recorded after Friday’s close, and it’s the one where I shorted NVIDIA. Live is where I talk less about fundamentals and more about price action and what it’s doing to the market. I’m not a technical investor. I try to apply Bruce Lee’s Jeet Kune Do to investing: take what’s useful from every style, discard the rest, and don’t get boxed in. I have a clear value bias, but that doesn’t stop me taking a growth view, a technical view, a special situation, or a big macro view like the Big Long in oil I have on right now.
This post is in two parts. Part 1 covers the themes: why the leaders are the last to fall, why the NVIDIA chart is the one that matters, why industrials are leading the market down, and why oil above $100 with a hiking Fed is a bad backdrop for risk assets. Part 2 goes through every name I discussed, with my view and the levels I’m watching. The positions themselves sit in the Babylon Burns portfolio, and members get a notification every time I trade.
Part 1: The themes
The leaders are the last to fall
People use the index to call the end of a bull market. The index comes down, so the bull is over. That’s not what matters. The great speculators worked out that you look at the stocks that added the most market cap and the stocks that went up the most, and you ask how they’re doing. Indices are built from sub-sector indices, which are built from stocks. If you see something on a sector chart, go and look at the biggest stocks in that sector.
In this bull market, which I called within a month or two of ChatGPT coming out, seven stocks added most of the market cap from the October 2022 low: NVIDIA and the rest of the Mag 7. They added only a few trillion dollars less than the other 493 S&P 500 stocks put together. That’s exactly how the market has felt for three years. But the stocks that went up the most in percentage terms aren’t Apple, Microsoft and Google. They’re the AppLovins and Microns of this world, the more speculative AI build-out names. NVIDIA is on both lists.
Those build-out names have already rolled over. Broadcom topped at $495 and trades at $320. Micron is at $877 against a high of $1,255. AMD is at $516 against $658, Cisco at $106 against $130, and Intel at $86 against $142. Lam Research and Applied Materials are both down about 50% from their highs. Meanwhile Amazon, Apple, Microsoft and NVIDIA haven’t done much.

That’s the classic sequence. The go-go names break first. The leaders get a last hurrah. Then the leaders turn, and the whole thing turns. The value names that money rotated into, Berkshire, JPMorgan and the like, are doing fine. It’s the leaders holding the index together, and that’s why NVIDIA is the most important chart in markets right now.
For disclosure, I made Broadcom the largest position in my portfolio after ChatGPT came out, and it went up 9x. I sold a lot on the way up, which was a mistake, and I exited the final stub around $350 because the price action had rolled over. I don’t own any Broadcom anymore.
NVIDIA: a wedge inside a wedge
Go back through the history. NVIDIA had its cycle, a small adjustment in the pandemic, then the rate hikes during elevated inflation brought it down. From the October 2022 low it went ballistic. In May and June 2023 it gapped up on good news, and after that gap it started forming a rising wedge.
A rising wedge gives you higher highs and higher lows, but each thrust from low to high has less amplitude than the one before. Buyers keep coming back to take control from the sellers, but each time with less enthusiasm and less ammunition. Eventually that becomes buyer exhaustion. The expected resolution is that the buyers give way, the sellers take over, and the price falls.
The big wedge has been violated a little on the upside and undershot a little on the downside, which creates a second, intermediate wedge inside the first. I’ve had this chart on my desk all week. My view was that a weekly close below $212 would signal the intermediate wedge had exhausted itself. It had a first touch, a second touch, and a third point that looked like support and broke down instead. Meanwhile the 200-day moving average has climbed to the lower boundary of the big wedge, and NVIDIA now looks like it’s coming down to test it.
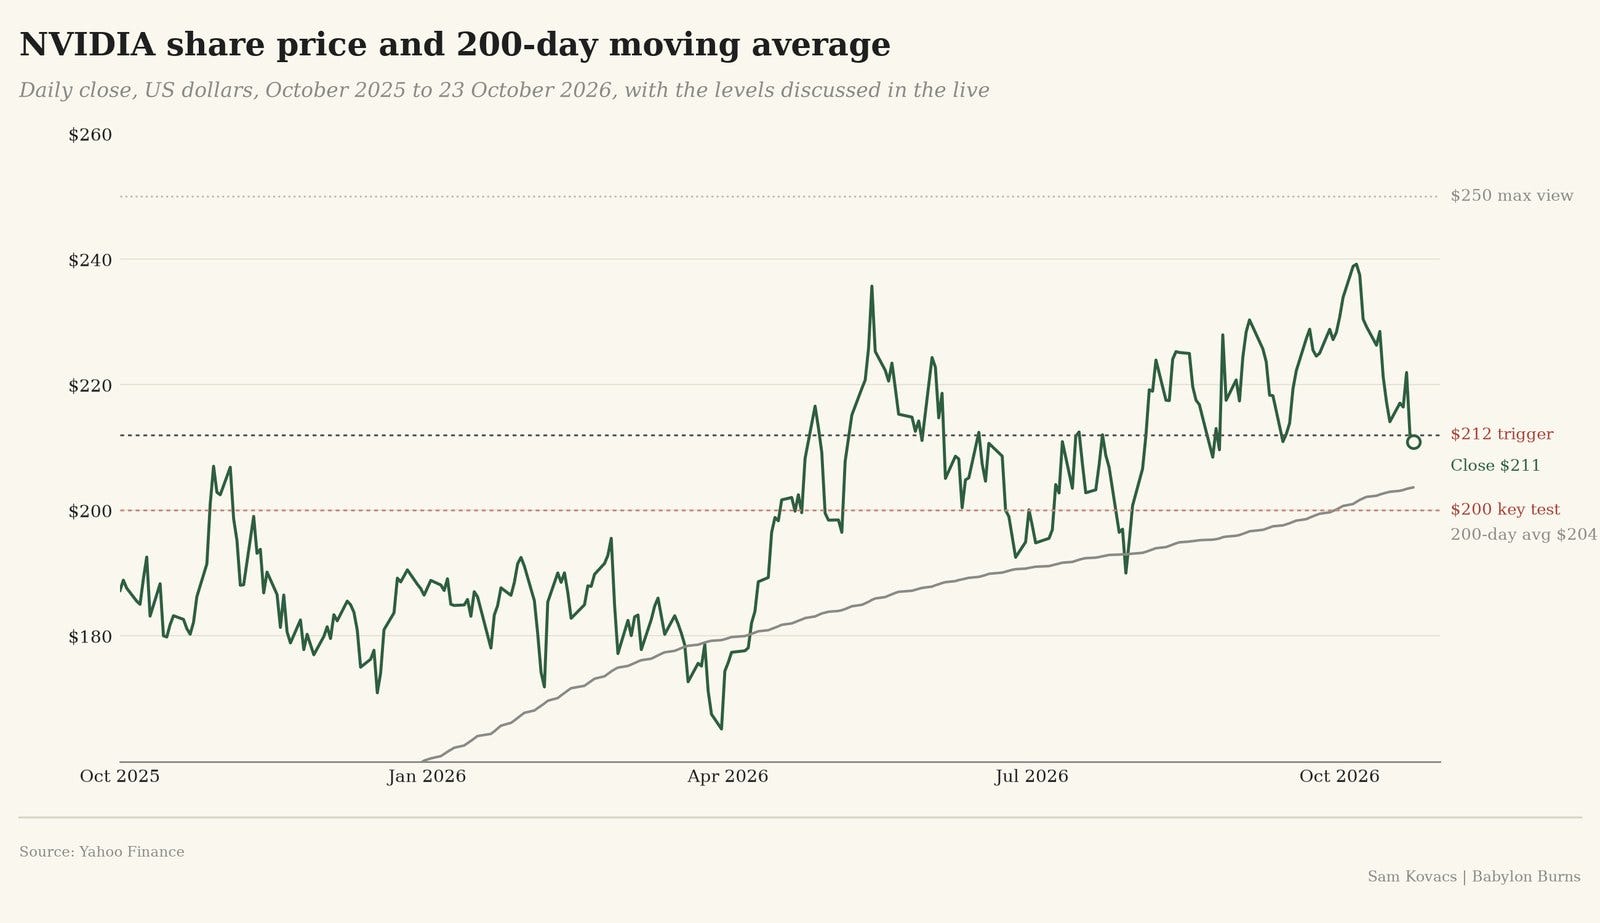
I expect a move to $205 or $204 over the next week. The key test is a close below $200. It’s an important psychological number, but more than that, every previous close below $200 happened inside the pattern. A close below $200 now is outside the long-term rising wedge, which would tell you buyers are no longer stepping in where they usually do. If that happens, I think it’s bearish for the entire market a few months out. The chart says this resolves by the end of Q1, and the bias is down.
Back in June, in my piece on Meta showing the cracks in the AI trade, I said my max view for NVIDIA was around $250. I didn’t short it then. There are three boxes for trades: good, bad, and too complicated. Sometimes you don’t have an edge, and you stay aside. You don’t need to take part in everything to do very well.
Industrials are leading the market down
Industrials have a long-term channel that started at the 2009 low. Inside it sits a mostly clean rising wedge, with four touches on top and three on the bottom (five if you ignore the April 2025 washout), and that wedge has broken down. So has the shorter-term line. The technicals say there’s more to give back.
I’m not a pure technical guy. What I see on the chart has to make fundamental sense, otherwise it’s castles in the sky and Sam drawing lines. Here it does. Industrials trade on one of the highest price-to-earnings ratios of any S&P 500 sector, possibly the highest, above tech. The AI debt story, the neoclouds and the rest of it, has started to crumble in the headlines. These industrials were the picks-and-shovels play on power and electrification across the AI complex, and their valuations went sky high on it. Now they’re at risk of coming back down.
Then there’s the feedstock. The physical economy runs on oil and refined products, and the feedstock for the industrial sector is diesel or some derivative of it. Brent is $117, and the back end of the strip, the December 2027 contract, is well above $80. Prices paid by these companies are going through the roof. That squeezes margins, which squeezes already high valuations, and it’s happening while the Fed is hiking.
The top ten holdings of XLI confirm the sector chart. Caterpillar, GE Aerospace, Eaton, Boeing and Parker-Hannifin all look bearish. Union Pacific looks bullish. Deere, RTX, Lockheed and Trane are neutral or no view.
GE’s earnings this week told the same story: beat, beat, beat, decent guidance, and the stock sold off because the projected rate of growth is below what it’s been for years. Good news is being sold. That’s distribution. With liquidity tighter, it doesn’t make sense to pay 30 times next year’s earnings for these stocks. A stock that’s already down can always go down more. If it’s not zero, it can go lower.
I set this up in the portfolio as rotational long/short rather than Coke-and-Pepsi long/short. I’m short the names that look bad and long other industrial names that look better. It doubles up on the rotation view while keeping equity exposure to the upside. Under Reg T, a long and a short together give you gross exposure both ways without locking up more capital than a long-only cash account would.
Oil over $100 and a Fed that’s hiking
Going into the year, the consensus was that oil would be benign and rates would come down. That was my view too, until 21 February, when I saw it wasn’t going to work and that I needed to go long oil. Now oil is back over $100, inflation is picking up and moving through the value chain, and rates are up.
The story on the Fed is that they won’t cut into the midterms and won’t hike into them either. They’ll hold, use hawkish language, and hike again in December. I’ve stopped offering variant views on what the Fed does. I’d rather react, because rates have more of a long-term impact than the market’s knee-jerk reaction suggests. Tightening is like dieting. Eat a salad today and you don’t lose weight. Stay in a calorie deficit for a few months to a few quarters and the number on the scale moves. Rates take time to work through the economy and stifle everyone, and they’re working through now.
Then add the questions on AI capex returns. Capex over the next two to three years won’t come in at the projected rate, and it’s becoming clear to everyone that trees don’t grow to the sky. The squeeze is coming from every direction: rates, input costs and capex expectations.
How the book is positioned
The environment is dangerous and explosive at the same time, so the book is defensive but not passive. Energy is still the best setup in the market. Healthcare is the second best. Industrials are the worst, consumer discretionary the second worst, and tech is still in play, but all the big names are losing steam.
Energy is the biggest bet, and I’ve added to it throughout and rotated inside it. Then there are the rotational pairs in industrials and the country long/shorts: one in Latin America, one in Europe and two in Asia Pacific, all going well. The healthcare names and some small tech positions are doing well too, and I’ve cut a few quick losers.
Cutting the quick losers is the point. Klipp’s paradox says you have to love to lose and hate to win. Most people do the opposite. They love to win, so they grab any gain quickly, and they hate to lose, so they hold the losers hoping they come back. That’s human nature, and I’ve burnt the correction into my skull. A quick loss is good. A quick win is bad, because as Peter Lynch said, selling your winners to add to your losers is pulling out the flowers to water the weeds. You need many ideas, you need to be ready to give them up, and when one starts working you trust it and add capital. That’s exactly what I did with energy.
The bigger picture
Once you’ve been making easy money for long enough, something must be wrong. When Buffett first recommended index investing, only a small slice of assets was passive. Now the majority are. History says that when everyone agrees something is the right thing to do, it usually isn’t. Pure equity returns over the next ten years don’t look great, and they look worse in real terms once you adjust for the dollar. Real assets look interesting, but any real asset that’s levered or long duration looks bad right now: gold down, silver down, Bitcoin down, tech rolling over, the Fed hiking. To play that you have to be nimble and willing to go both ways, long and short. The question for everyone is how their portfolio is set up for this, and whether the tide is about to go out while they’re skinny dipping.
Part 2: The positions
Here’s every name I discussed in the live and what I said about it. The chart is the summary and the detail follows. Prices are the 23 October closes.

NVIDIA (NVDA): short
I shorted NVIDIA going into Friday’s close. I’d tweeted during the day that I didn’t like NVIDIA below $212, and a few minutes before the close it was at $211. I thought the odds of it closing back above my trigger were poor, so I sent it. It’s a small, very low conviction short in the member portfolio. It doesn’t put the book in jeopardy, and there’s a good chance it doesn’t work.
The thesis is the wedge inside the wedge from Part 1. A weekly close below $212 signals the intermediate wedge has exhausted itself, and the 200-day moving average has climbed to meet the lower boundary of the pattern. I expect $205 or $204 over the next week. The key test is a close below $200, which would put the price outside the long-term rising wedge for the first time and tell you buyers aren’t stepping in where they always have. If NVIDIA loses $200, I think the whole market turns bearish a few months out, with a last hurrah for Apple, Microsoft and Amazon first. My max upside view is still around $250, as I said in June. The chart resolves by the end of Q1, and the bias is down. This is the first tech short I’ve put on.
GE Aerospace (GE): short
Members got the GE short alert this week. The company beat on every line with decent guidance, and the stock went down anyway. It’s selling off because the projected rate of growth is below what it’s been for years, and at 30 times next year’s earnings, with liquidity tighter, that’s a problem. Last year you could pay whatever you wanted for GE and double your money. Now good news is being sold, which is the usual distribution pattern. The stock is already down, at $285.64, and it can go lower. I’m not saying GE goes bankrupt, or to $10 or $20. I’m saying the chart looks bad. In the member portfolio it’s paired against a long in another industrial.
Parker-Hannifin (PH): short
This is a horrendous chart, the kind you can see from a distance. Left shoulder, head, right shoulder, and a neckline the stock has poked below. It’s breaking through long support lines. Maybe it goes sideways, maybe it goes back to $770, but this isn’t the price action you want to see. It’s only 20% below its $1,098 all-time high, and it can correct a lot more on valuation and slower growth. It’s a short in the member portfolio, paired against a long.
Caterpillar (CAT): bearish, no position
Caterpillar is the biggest industrial and a cyclical, so it goes up and down even when the long-term direction is up and to the right. It broke out of a strong resistance level around September 2025 and went vertical, from about $400 to over $1,000. That’s a 2.5x in about a year, where previous 2.5x moves took years. Then a new resistance line emerged, a distribution pattern formed, not perfect but good enough, and the support line at about $775 gave way. Since the break it’s fallen to $687, more than 10% lower, and it now sits 36% below its $1,071 all-time high. Maybe that’s the end of the correction. Maybe it gives back more and tests the old resistance line at about $550, which should now act as support. I don’t know. I don’t have insight into Caterpillar’s business or a good read on its financials. But it’s a bearish chart any way you slice it: head and shoulders, support broken, and a long-term trend far below the price.
Eaton (ETN): bearish, no position
Eaton was one of my short candidates and I didn’t follow through. I think I got bored. It’s the same wedge formation as the industrials sector, a mirror image of it, and it’s breaking below the wedge now. That’s dangerous. The downside could be the $315 level just below, or $300, or $250. I don’t have the answer, but it looks bearish.
Boeing (BA): bearish, no position
I don’t have a strong view on this one, and I don’t love how the lines are drawn, though with five touches it’s not bad if you exclude early 2025. It broke down from a triangle rather than a wedge and it’s heading lower. Bearish bias.
Union Pacific (UNP): bullish, no position
Interestingly, Union Pacific looks bullish. It built a big base, broke above resistance, retested it, and is holding above. Nice support below, resistance broken. It’s the one constructive chart in the group.
Deere (DE): neutral, no position
Unlike GE, Deere has held up well. It’s in a channel from $650 and could go back to $730, about 10% upside. If it went down, there’s a bit further to fall before you’d expect support. The risk reward isn’t out of this world and it isn’t horrendous. You could argue it’s forming a handle and goes on to new all-time highs. If one of the ten makes sense as a long, it’s Deere. Sometimes you don’t get a read, and that’s fine.
RTX, Lockheed, Trane and Uber: no view or no interest
RTX doesn’t look bearish. It came down to its long-term line and bounced, and new all-time highs 20% above are possible. Maybe that’s a bullish swing, but I’m not interested. Lockheed broke out of a resistance line and has some support below, but I don’t know what I’m looking at and I don’t have a view. Trane has a wedge inside a longer-term channel, not yet broken, with a possible head and shoulders that isn’t clean. It could turn bearish, but you can’t call it on the price action yet.
Uber needs to digest. It’s already gone from $100 to $66, and it doesn’t look like it has crazy downside from here, though it can always go lower, maybe into the high $50s before it finds support, and that could take a year or two. I don’t want to be in a stock going nowhere. Wait for confirmation. Never force a view onto a chart. The second you force your ideas over the truth, you’re done. Never let a good story get in the way of the truth.
Amazon, Alphabet and Microsoft: the leaders losing steam, no positions
Amazon still looks fine in the big scheme of things, but if you connect the tops you get a clear intermediate wedge inside the bigger one, and the price is sitting right on the line, which is not where you want it. That could mean a 5% correction, or like NVIDIA it could be more. Alphabet has broken its support and buyers are now defending the $300 to $315 area. The chart says it resolves one way or the other by the end of Q1, and the bias is down. Microsoft is more of a channel than a wedge, so it stays bullish for longer, but the bottom of the channel is a 20% correction and the top is about a 15% gain. That risk reward isn’t wonderful. I don’t think Microsoft returns the 3x or 4x of the last six years over the next six. Come back in six years and tell me I was wrong.
The energy sleeve: long
Oil is still above $100, Brent is $117, and the December 2027 contract at the back of the strip is well above $80. The long energy positions are doing very well. I’ve added capital to the trade throughout and rotated inside it. I’ve written beautiful reports on energy names, with all the charts and all the analysis, then looked at the price, decided it wasn’t moving the way I wanted, and swapped into names with more Brent torque, like Murphy Oil. Energy still has the best setup in the market.
Long Brazil (EWZ) / short Argentina (ARGT)
I wrote this one up for free. It’s long the Brazil ETF and short the Argentina ETF. The short strips out some of the Latin America beta, the idea of the whole continent getting re-rated, and leaves a variant view that’s uncorrelated with the US economy: capital should rotate into Brazil from other emerging markets if Bolsonaro wins. Argentina gets a sympathy bid from the same idea, and its largest holding, Mercado Libre, makes half its revenue in Brazil, so there’s an offset inside the pair. Brazil stands to gain more. If Bolsonaro comes through, the real rate is higher, the Selic comes down, domestic institutional money moves from bonds into equities, foreign institutional flows come back, and they all pile into an index trading at 10 to 12 times earnings that’s heavily tilted to resources. I don’t think it’s a hard trade.
The other pairs, healthcare and small tech
The industrial pairs are rotational: short the names above and long other industrial names, so they double up on the rotation while keeping upside equity exposure. Beyond Brazil, there’s one country pair in Europe and two in Asia Pacific, all going well. The healthcare names are going well, some small tech positions are doing well, and I’ve cut a few quick losers.
Members got this NVDA short, the fills, the stops and every pair before the close. Upgrade to get every alert as it happens.
Know someone who’d want to watch this live? Send it their way.
None of this is financial advice.
As Babylon burns, we’ll light the cigars.


