
Meta Just Exposed the Biggest Problem in the AI Trade
The Cracks Are Starting to Show: Here's What I'm Doing...

On July 1st, Meta ($META) made an announcement none of the AI bulls would have expected: It is launching a cloud business to sell “excess compute”.
The next day, Zuck made very clear the rationale behind this decision when he said:
“The trajectory of the agentic development over at least the last four months hasn't really accelerated in the way that we expected”
The stock popped from $560 to $628, before giving back those gains and closing at $582 on Thursday.
And I think that price action on Thursday was telling and that the cracks are starting to show in the entire complex.
Now to be clear, I have been an AI bull earlier than most.
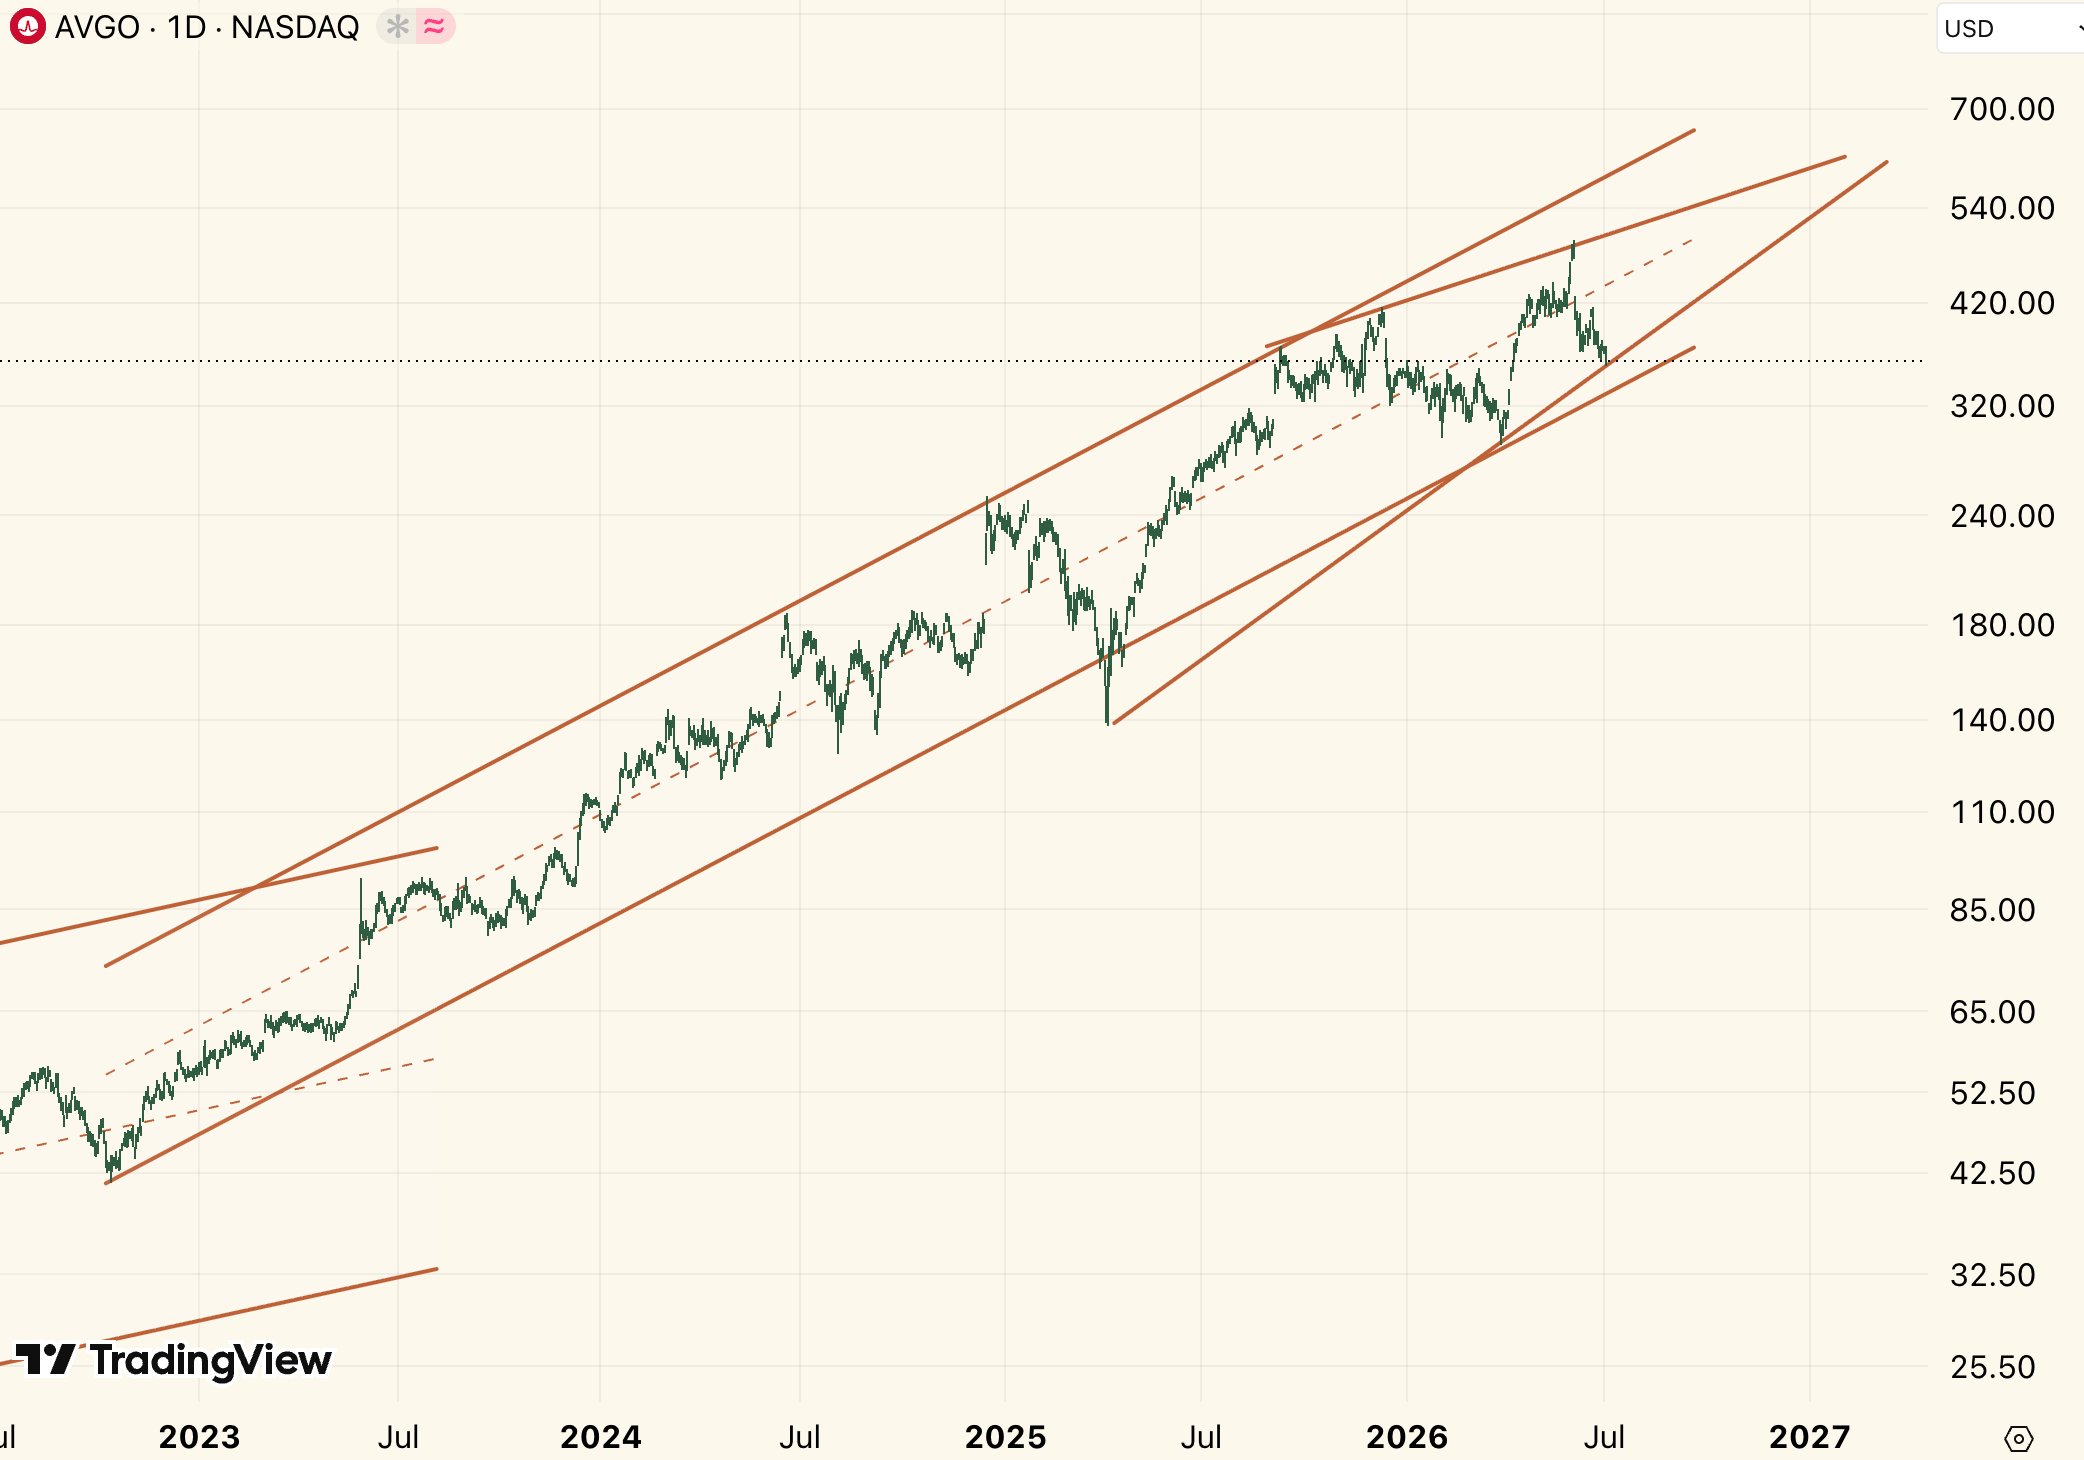
Among other picks, I’d been long Broadcom ($AVGO) since 2020 at $35, and made it the largest position of my portfolio in 2023 adding shares at $60, when I wrote a piece on SeekingAlpha saying that “ChatGPT marks a turning point in the AI revolution”.
I still have a position on what has been an 8 bagger. I am not a Jeremy Grantham or any other permabear who is salty because he got it wrong and missed the bus.
Yet, I’m becoming very concerned.
Why bother with timing at all?
As everyone knows, the difficulty lies in the fact that so much money stands to be made in these irrational bull markets, that it can be difficult to step back and say “enough is enough”.
Everyone knows we’re on a bus heading for a cliff, but if you get off the bus too soon, you’re just as wrong, if not more, than the guy who hurled himself off the cliff.
Like the chart below, (which I shared on X the other day) shows, the 2002 trough for the S&P 500 was 39% higher than when Jeremy Grantham called stocks “dramatically overpriced” in 1995.

There are two quotes that come to mind.
The first, from Peter Lynch:
Far more money has been lost by investors preparing for corrections, or trying to anticipate corrections, than has been lost in corrections themselves.
And the second from Howard Marks:
Being too far ahead of your time is indistinguishable from being wrong.
So one might ask why not just stay the course, and stick around for the long run?
Well, there are a few reasons. First is, in the long run we’re all dead. Second is, you have to do some soul searching and ask yourself if you truly have the constitution to endure 50-70% multi year drawdowns in your portfolio. Everyone has a plan, until they get punched in the face, as Mike Tyson liked to remind us.
Third, avoiding one nasty drawdown will do so much good for your net worth. (You can look up “On Minimizing Drawdown risks of lifetime investments” and “large drawdowns and long-term asset management” for the two papers on the topic).
Fourth, Peter Lynch’s comments came at the tail of a career which spanned 1977 to 1990, during which the nastiest correction happened between August 1987 and December 1990, when the S&P 500 corrected 33%. The 2002, 2009, and 2020 drawdowns all eclipsed the 1987 one.
We’re living in a regime of heightened volatility, of large governmental fiscal debts, of a massive yen carry trade providing marginal liquidity, of multipolar fracture. Everything suggests that the path forward is a volatile one.
There is real money in avoiding the unwinding of the AI trade.
Grab yourself a cup of coffee, and let’s get started.
When it all falls down.
It seem we livin' the American Dream, But the people highest up got the lowest self-esteem. The prettiest people do the ugliest things For the road to riches and diamond rings
- Kanye West, All Falls Down
The current AI buildout is based on a certain set of assumptions which impact the stocks at various parts of the value chain.
And a lot of it rests on The Jevons paradox, the nineteenth century observation that making coal engines more efficient increased coal consumption, because cheaper power found endless new uses. This has fuelled a large part of the AI buildout boom.
The baseline assumption is that every improvement in models, every decrease in the cost of tokens would expand demand as more tasks and workflows become economically viable.
Based on that logic, the appetite for computing is bottomless and unlimited capital expenditure is rational.
Based off of this assumption, the hyperscalers (Amazon, Google, Microsoft, Meta, and Oracle) have guided roughly $690bn in capital expenditure in 2026, up 81% YoY and 207% higher than in 2024. They’ve committed more, and will effectively be turning free-cashflow negative very soon.
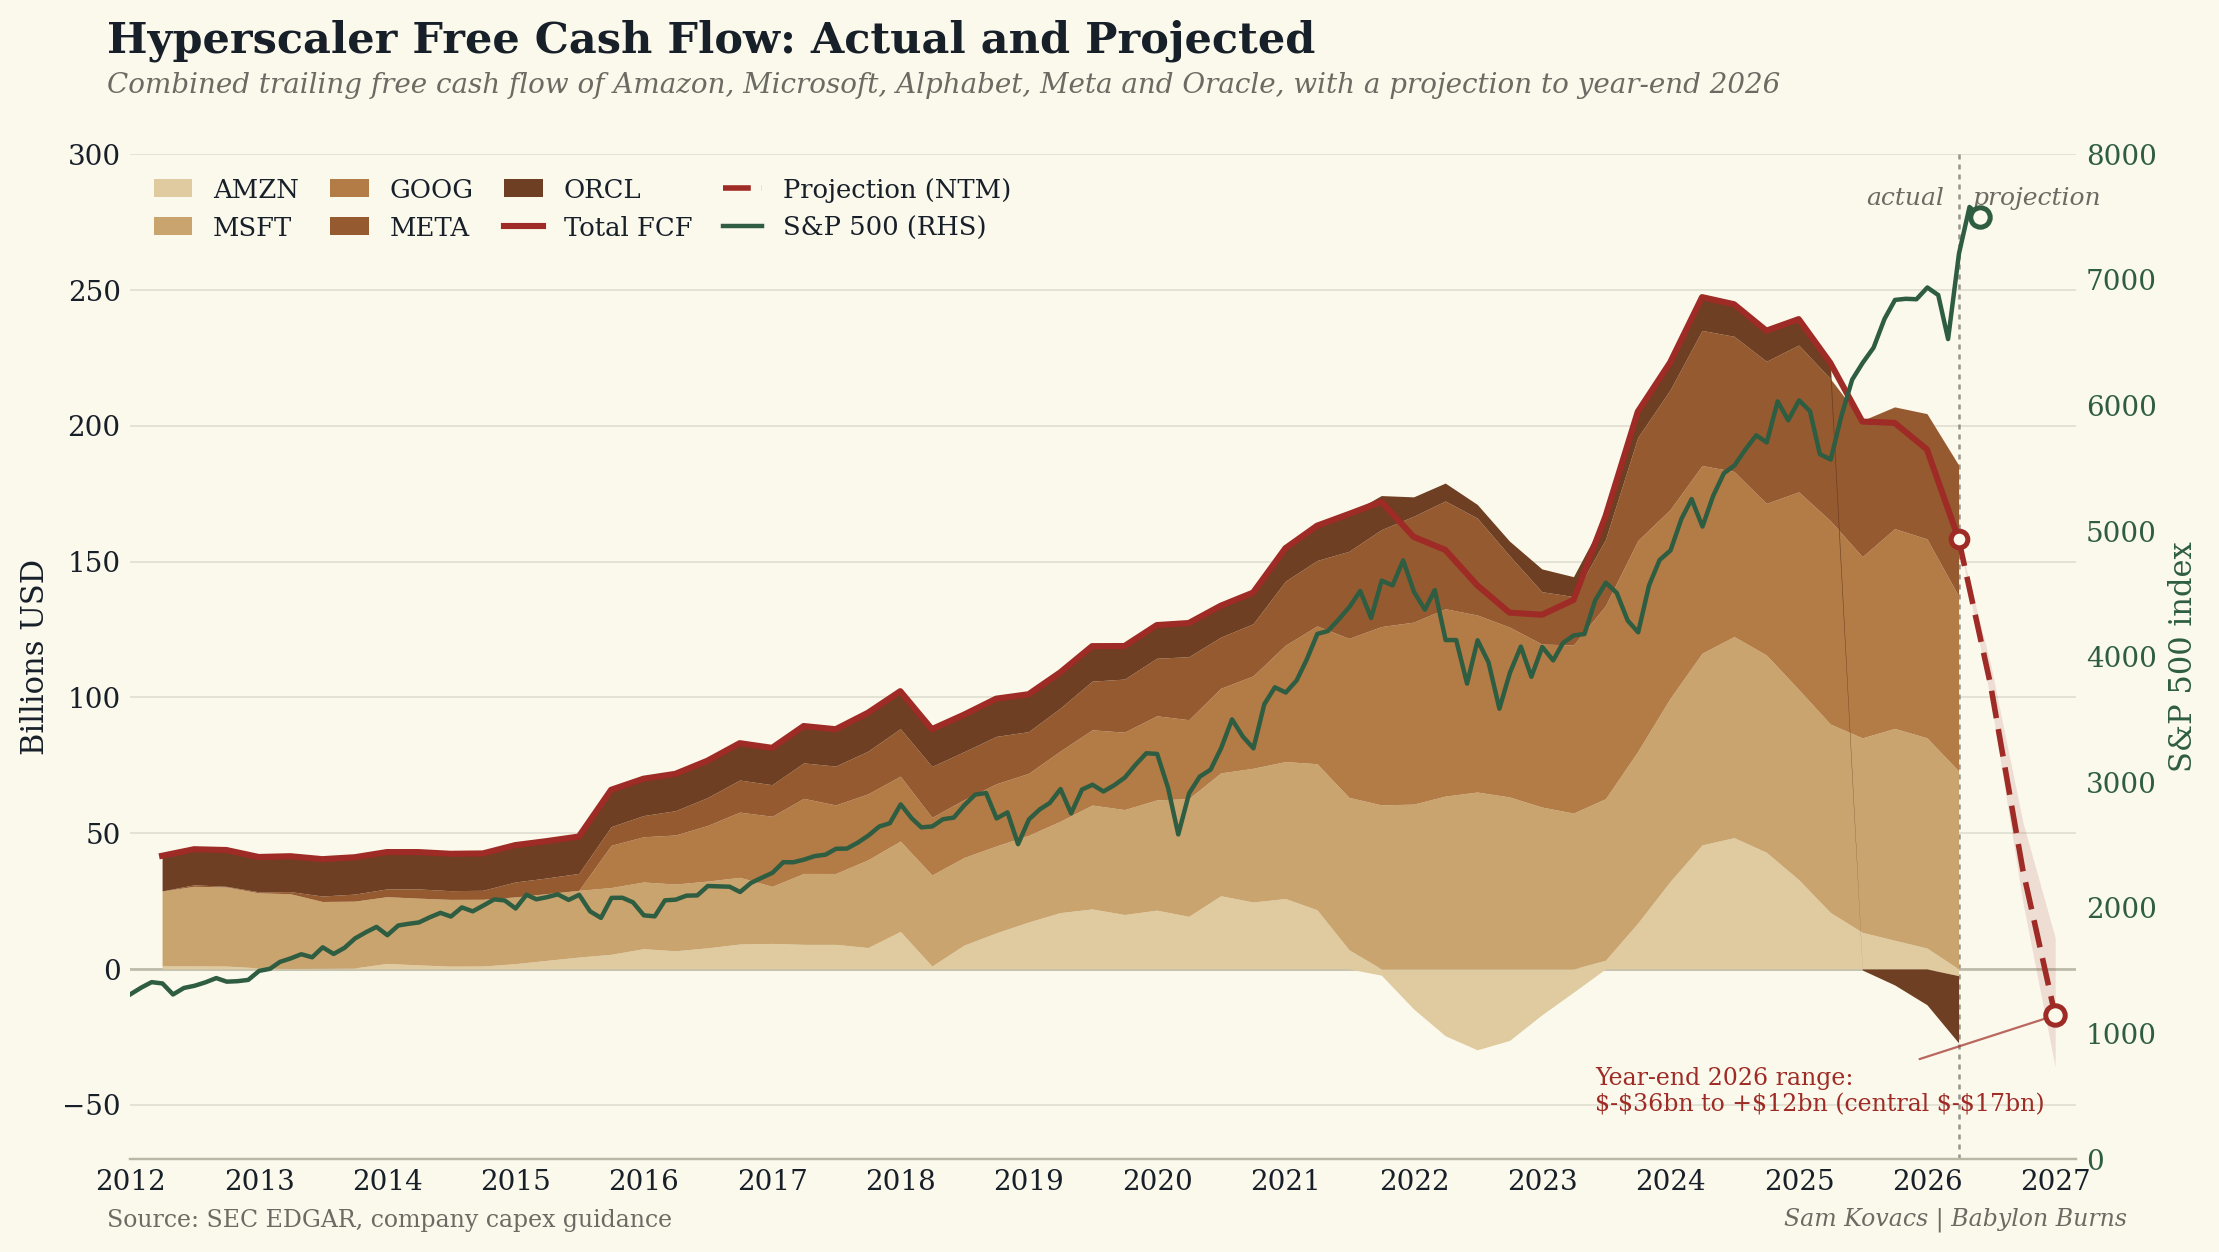
If the appetite for compute is infinite, then this makes sense.
But the Jevons paradox theory only makes sense if the cheaper inputs produce something which is actually worth buying. So underlying the whole spend is a massive assumption which is largely untested at this point: spending money on AI generates positive returns.
And unfortunately, this underlying assumption is starting to crack, and you’re hearing this from somebody who believes that the AI innovations we’ve seen since the launch of ChatGPT are most likely one of the most revolutionary technologies EVER.
I’m sure at this point, we’ve all read the MIT study (or at least the headlines) of enterprise AI pilots, that found that 95% of generative AI pilots delivered zero measurable PnL impact, against $40 billion of enterprise investment.
There are some fair critics of the methodology, but the direction is clear and validates my premise that I explained on George Noble’s podcast last week: AI induced productivity, and therefore AI returns, will take years, if not a decade to arrive.
This is well grounded in economic theory which I will only gloss over here.
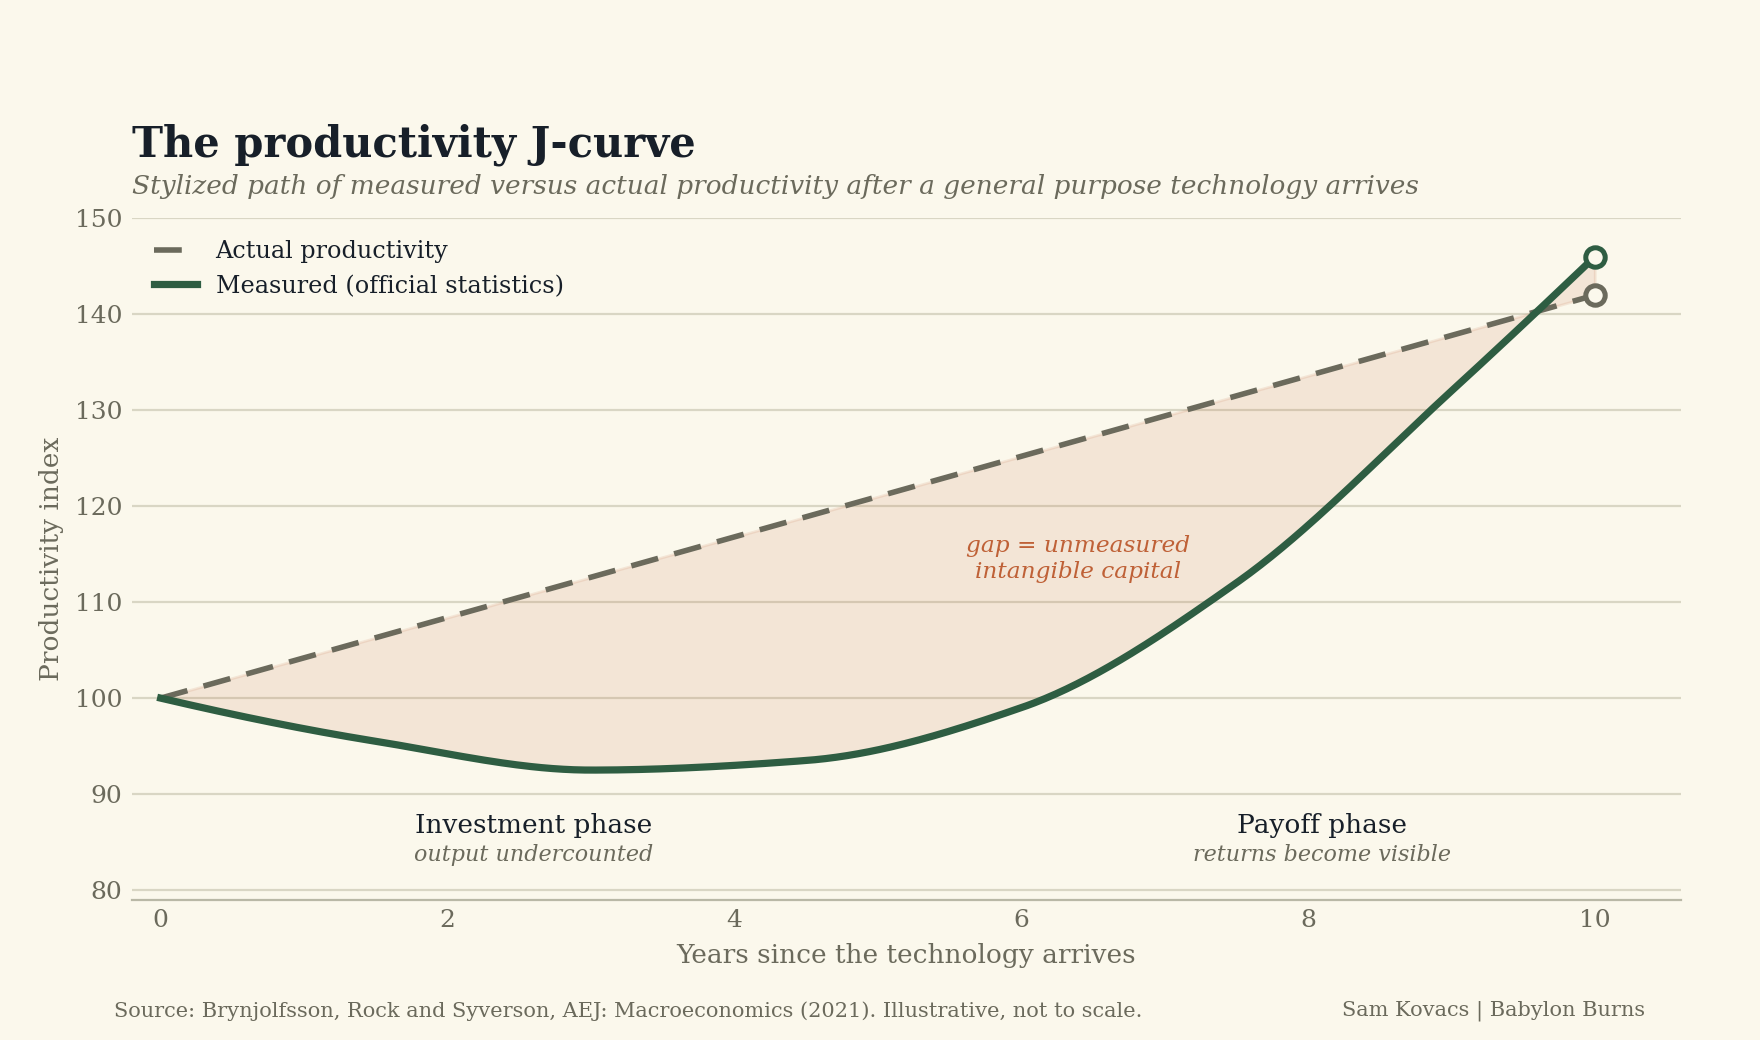
Brynjolfsson, Rock, & Syverson wrote a paper which posited that new general purpose technology will follow a productivity J Curve, which is to say that productivity goes down while firms redesign processes, retrain staff, reshuffle organizational structures and data pipelines.
The AI pilots are most of the time ad-hoc investments made by corporate America, the vast majority focused on sales and marketing, which concentrates probably the lowest leverage implementation of the technology.
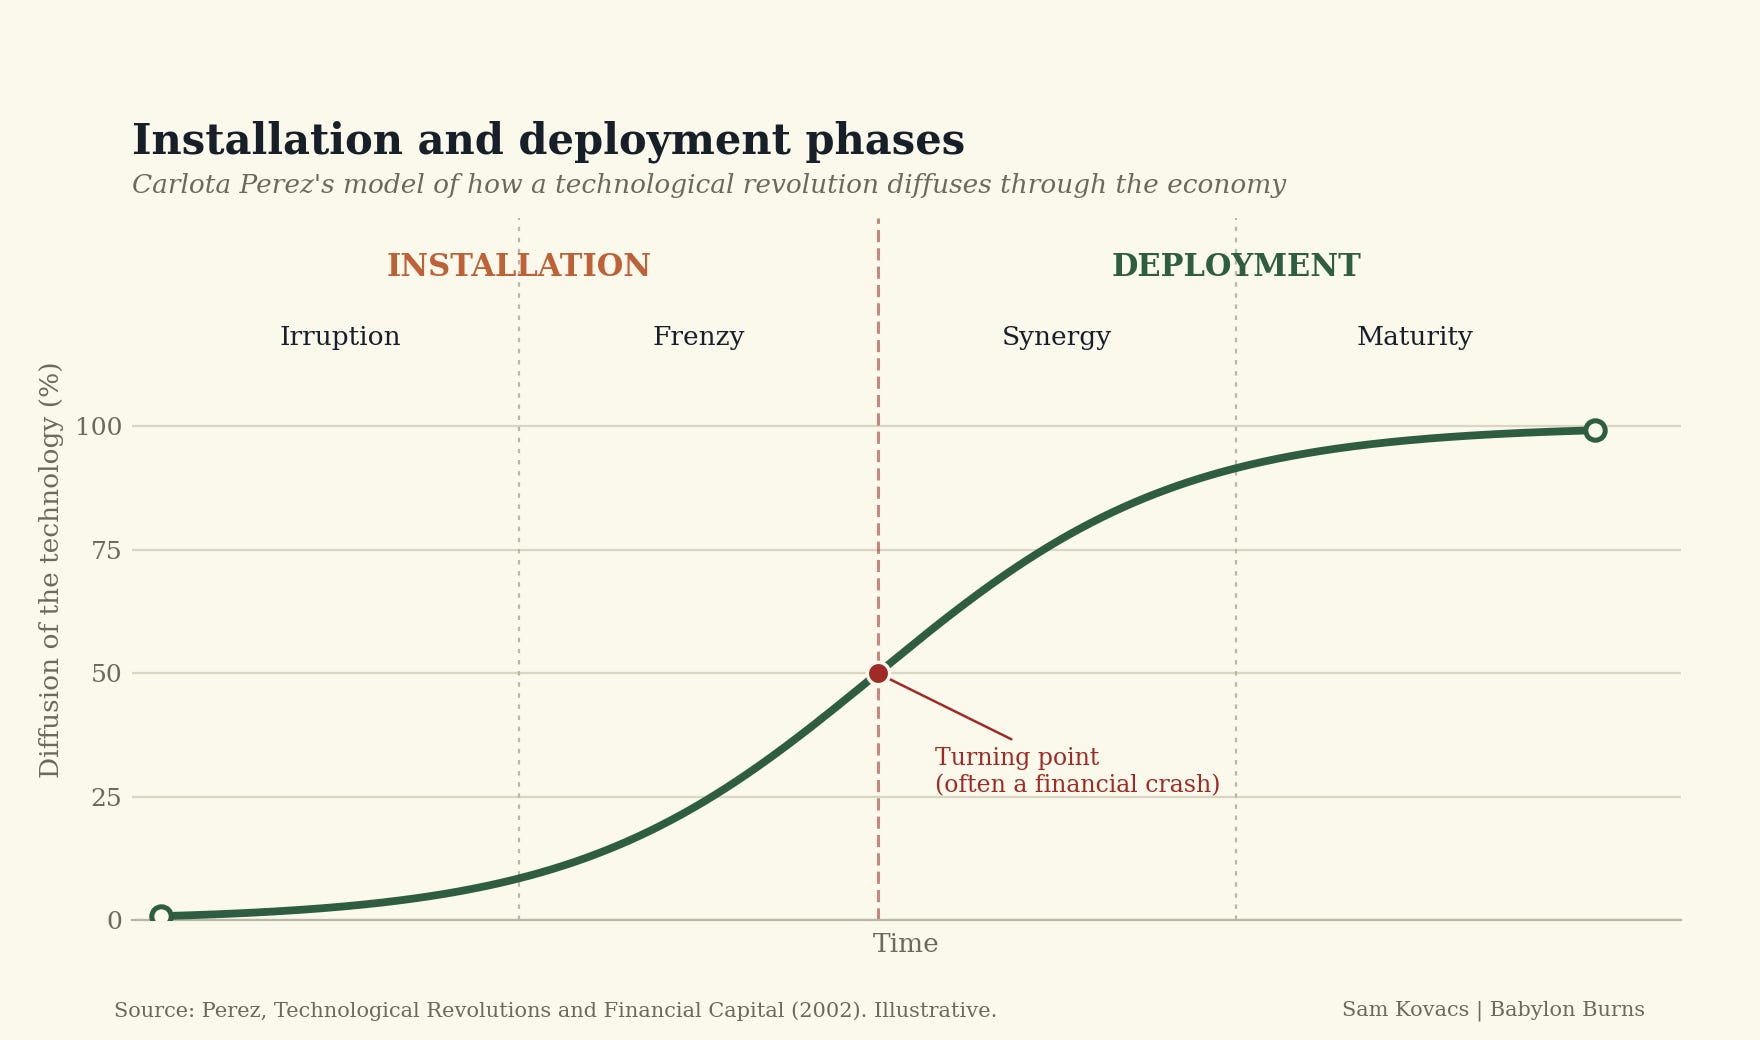
Carlota Perez has a similar framework of installation vs deployment phases of a new technology, with the added twist that there is usually a financial bubble then crash that happens during the installation frenzy. Sound familiar?
OpenAI and Anthropic are burning through cash as they engage in an arms race. Profitability is at best years out.
The whole argument of measurable returns that come in time is really coming into question when Meta says it has “excess compute”. Now Meta is a firm which arguably should have infinite hunger for compute, with 3.5 billion users, an advertising machine that converts intelligence into revenue, a lab of AI researchers which were hired at any price, and 15,000 lay-offs which were meant to allow for the massive investment into AI.
Back in May Zuck said that selling compute was definitely on the table if Meta overbuilt capacity, and just two months later is saying that “agent development did not accelerate as expected”.
The bulls found a way to spin this. Jefferies’ Brent Thill brought up the Amazon comparison: Meta is following the Amazon Web Services playbook that turned spare servers into the most profitable infrastructure business EVER.
I don’t buy it. Amazon created a market that didn’t exist and grew it for 20 years, Meta now is adding supply into a rental market which is already seeing questionable profitability. That was a euphemism.
The GPU hour will be the first casualty
By launching a cloud business to sell excess compute, Zuck is admitting that Meta overbuilt.
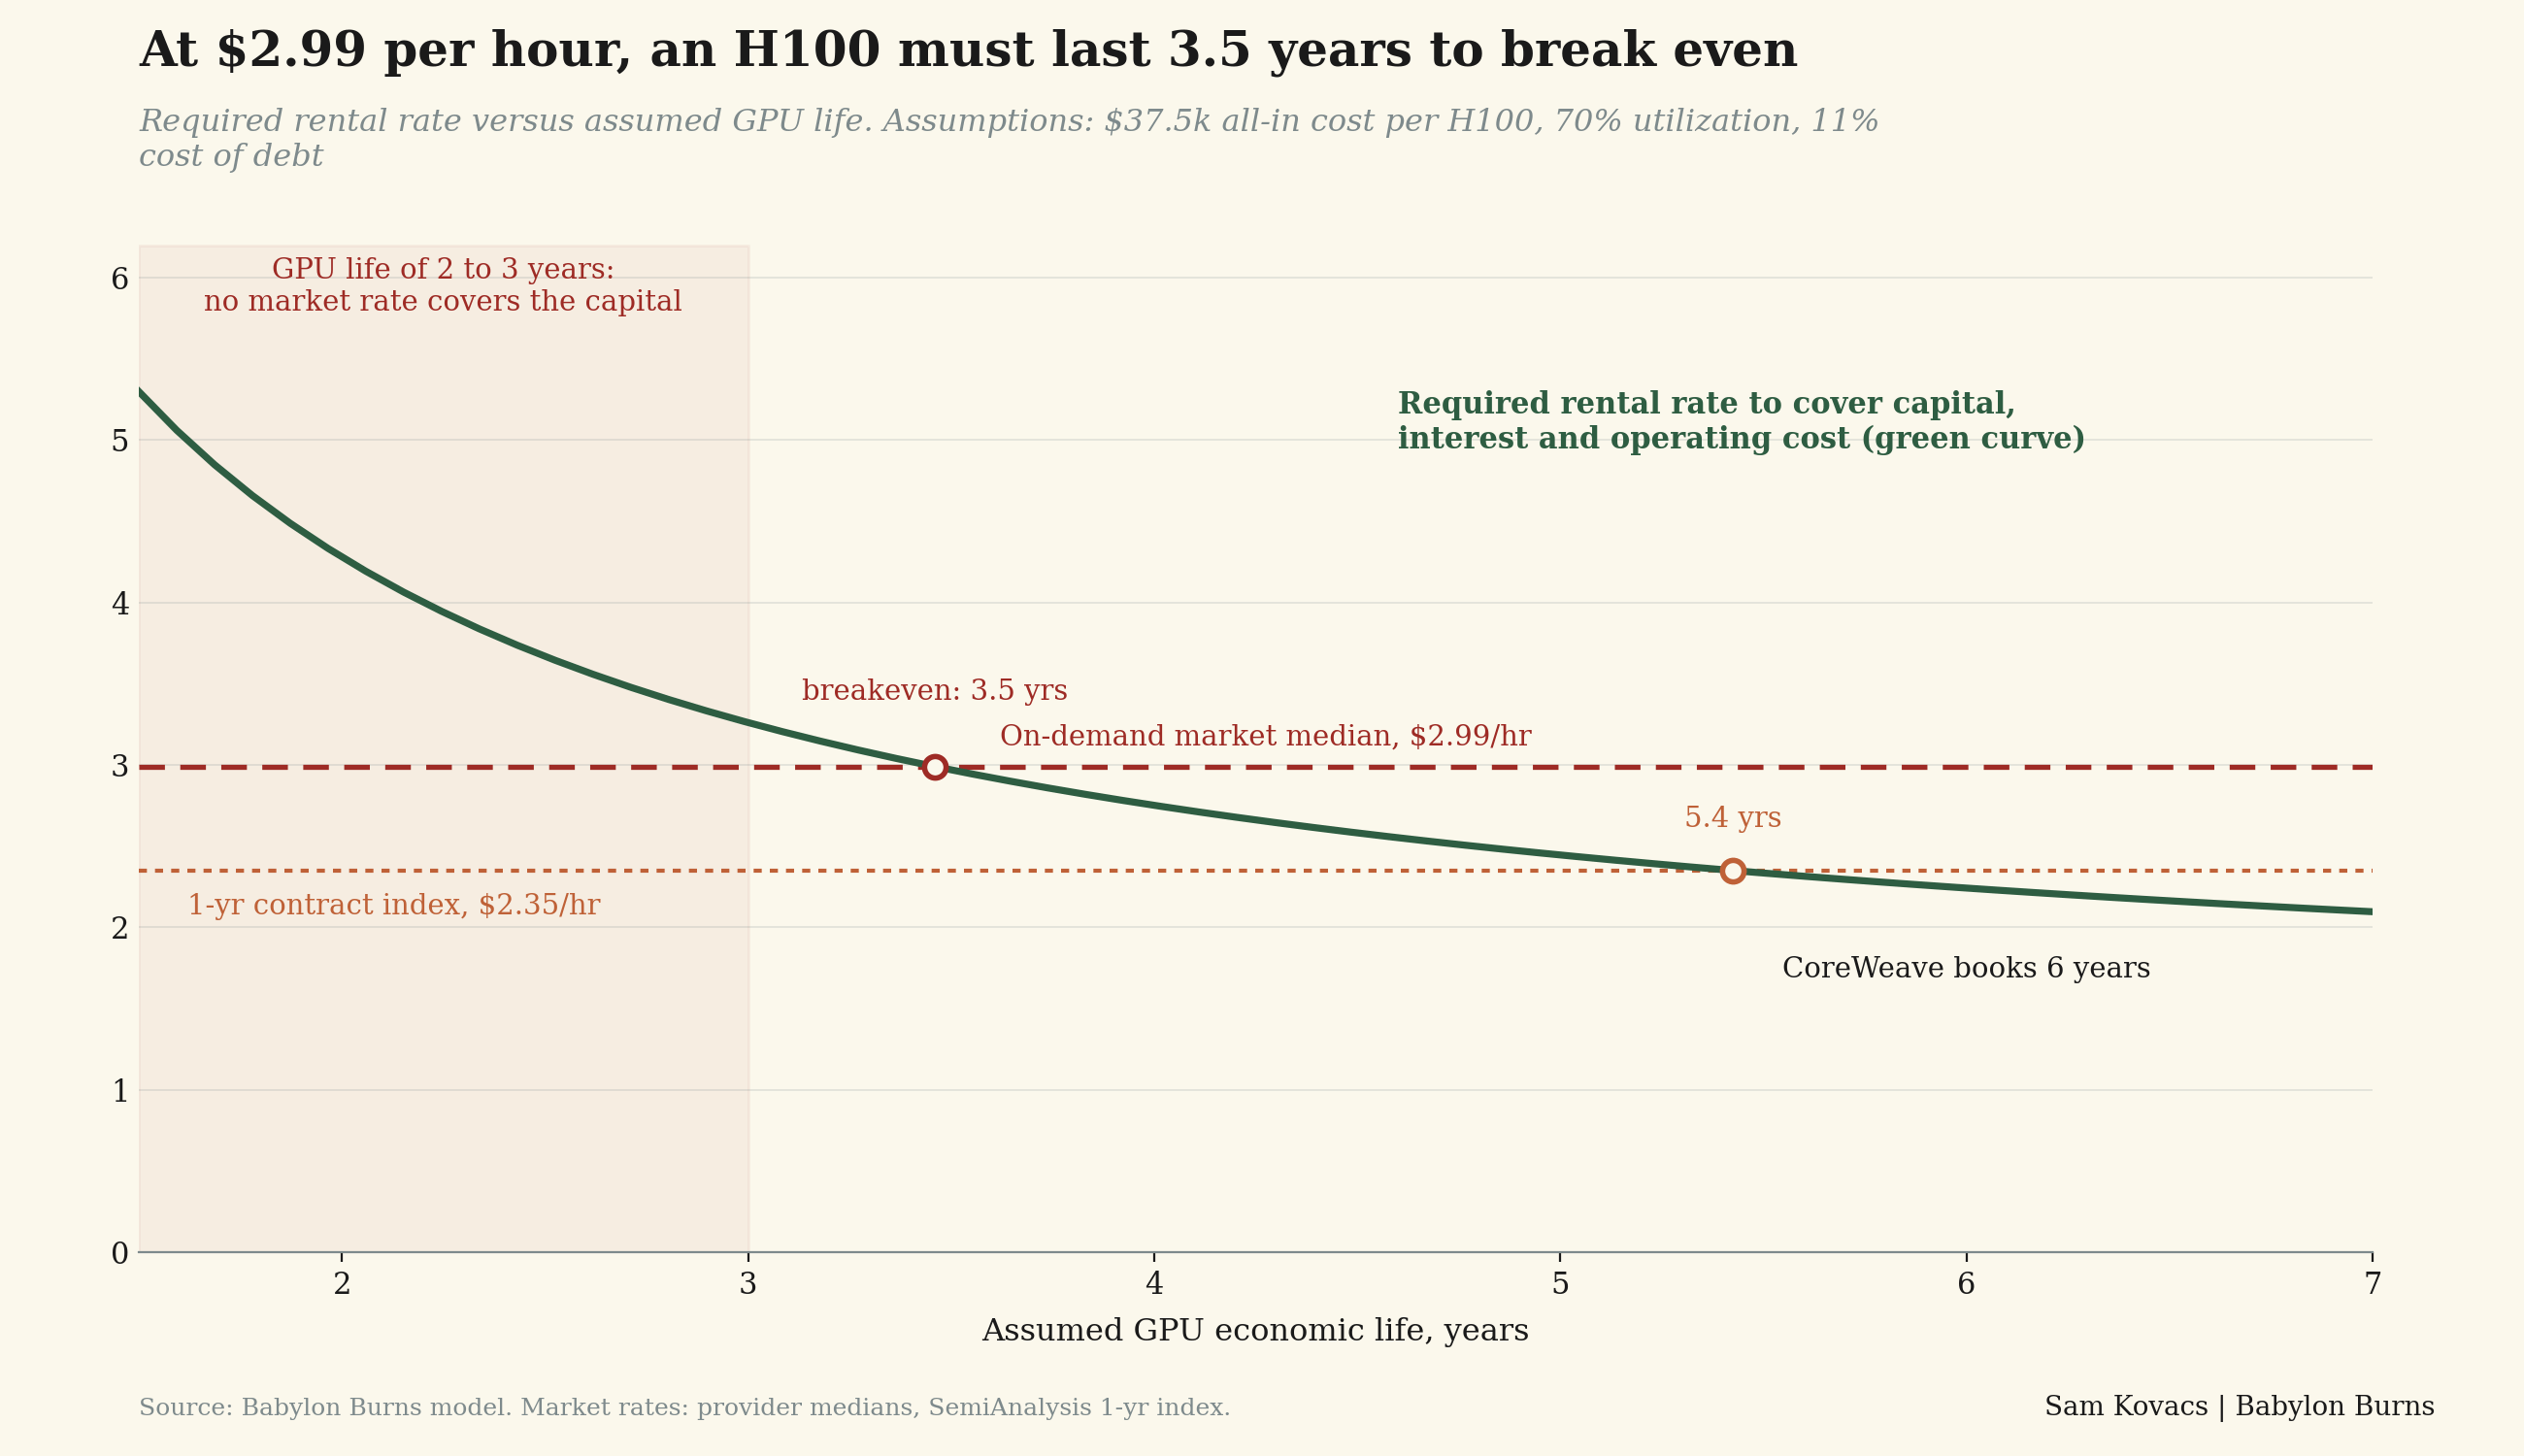
Selling compute was the Neo-Clouds business model. Nebius ($NBIS) and CoreWeave ($CRWV) financed the buildout of servers with debt that cost 9% to 15%. But the price of an hour of GPU is down from $8 in 2024 to $2.99.
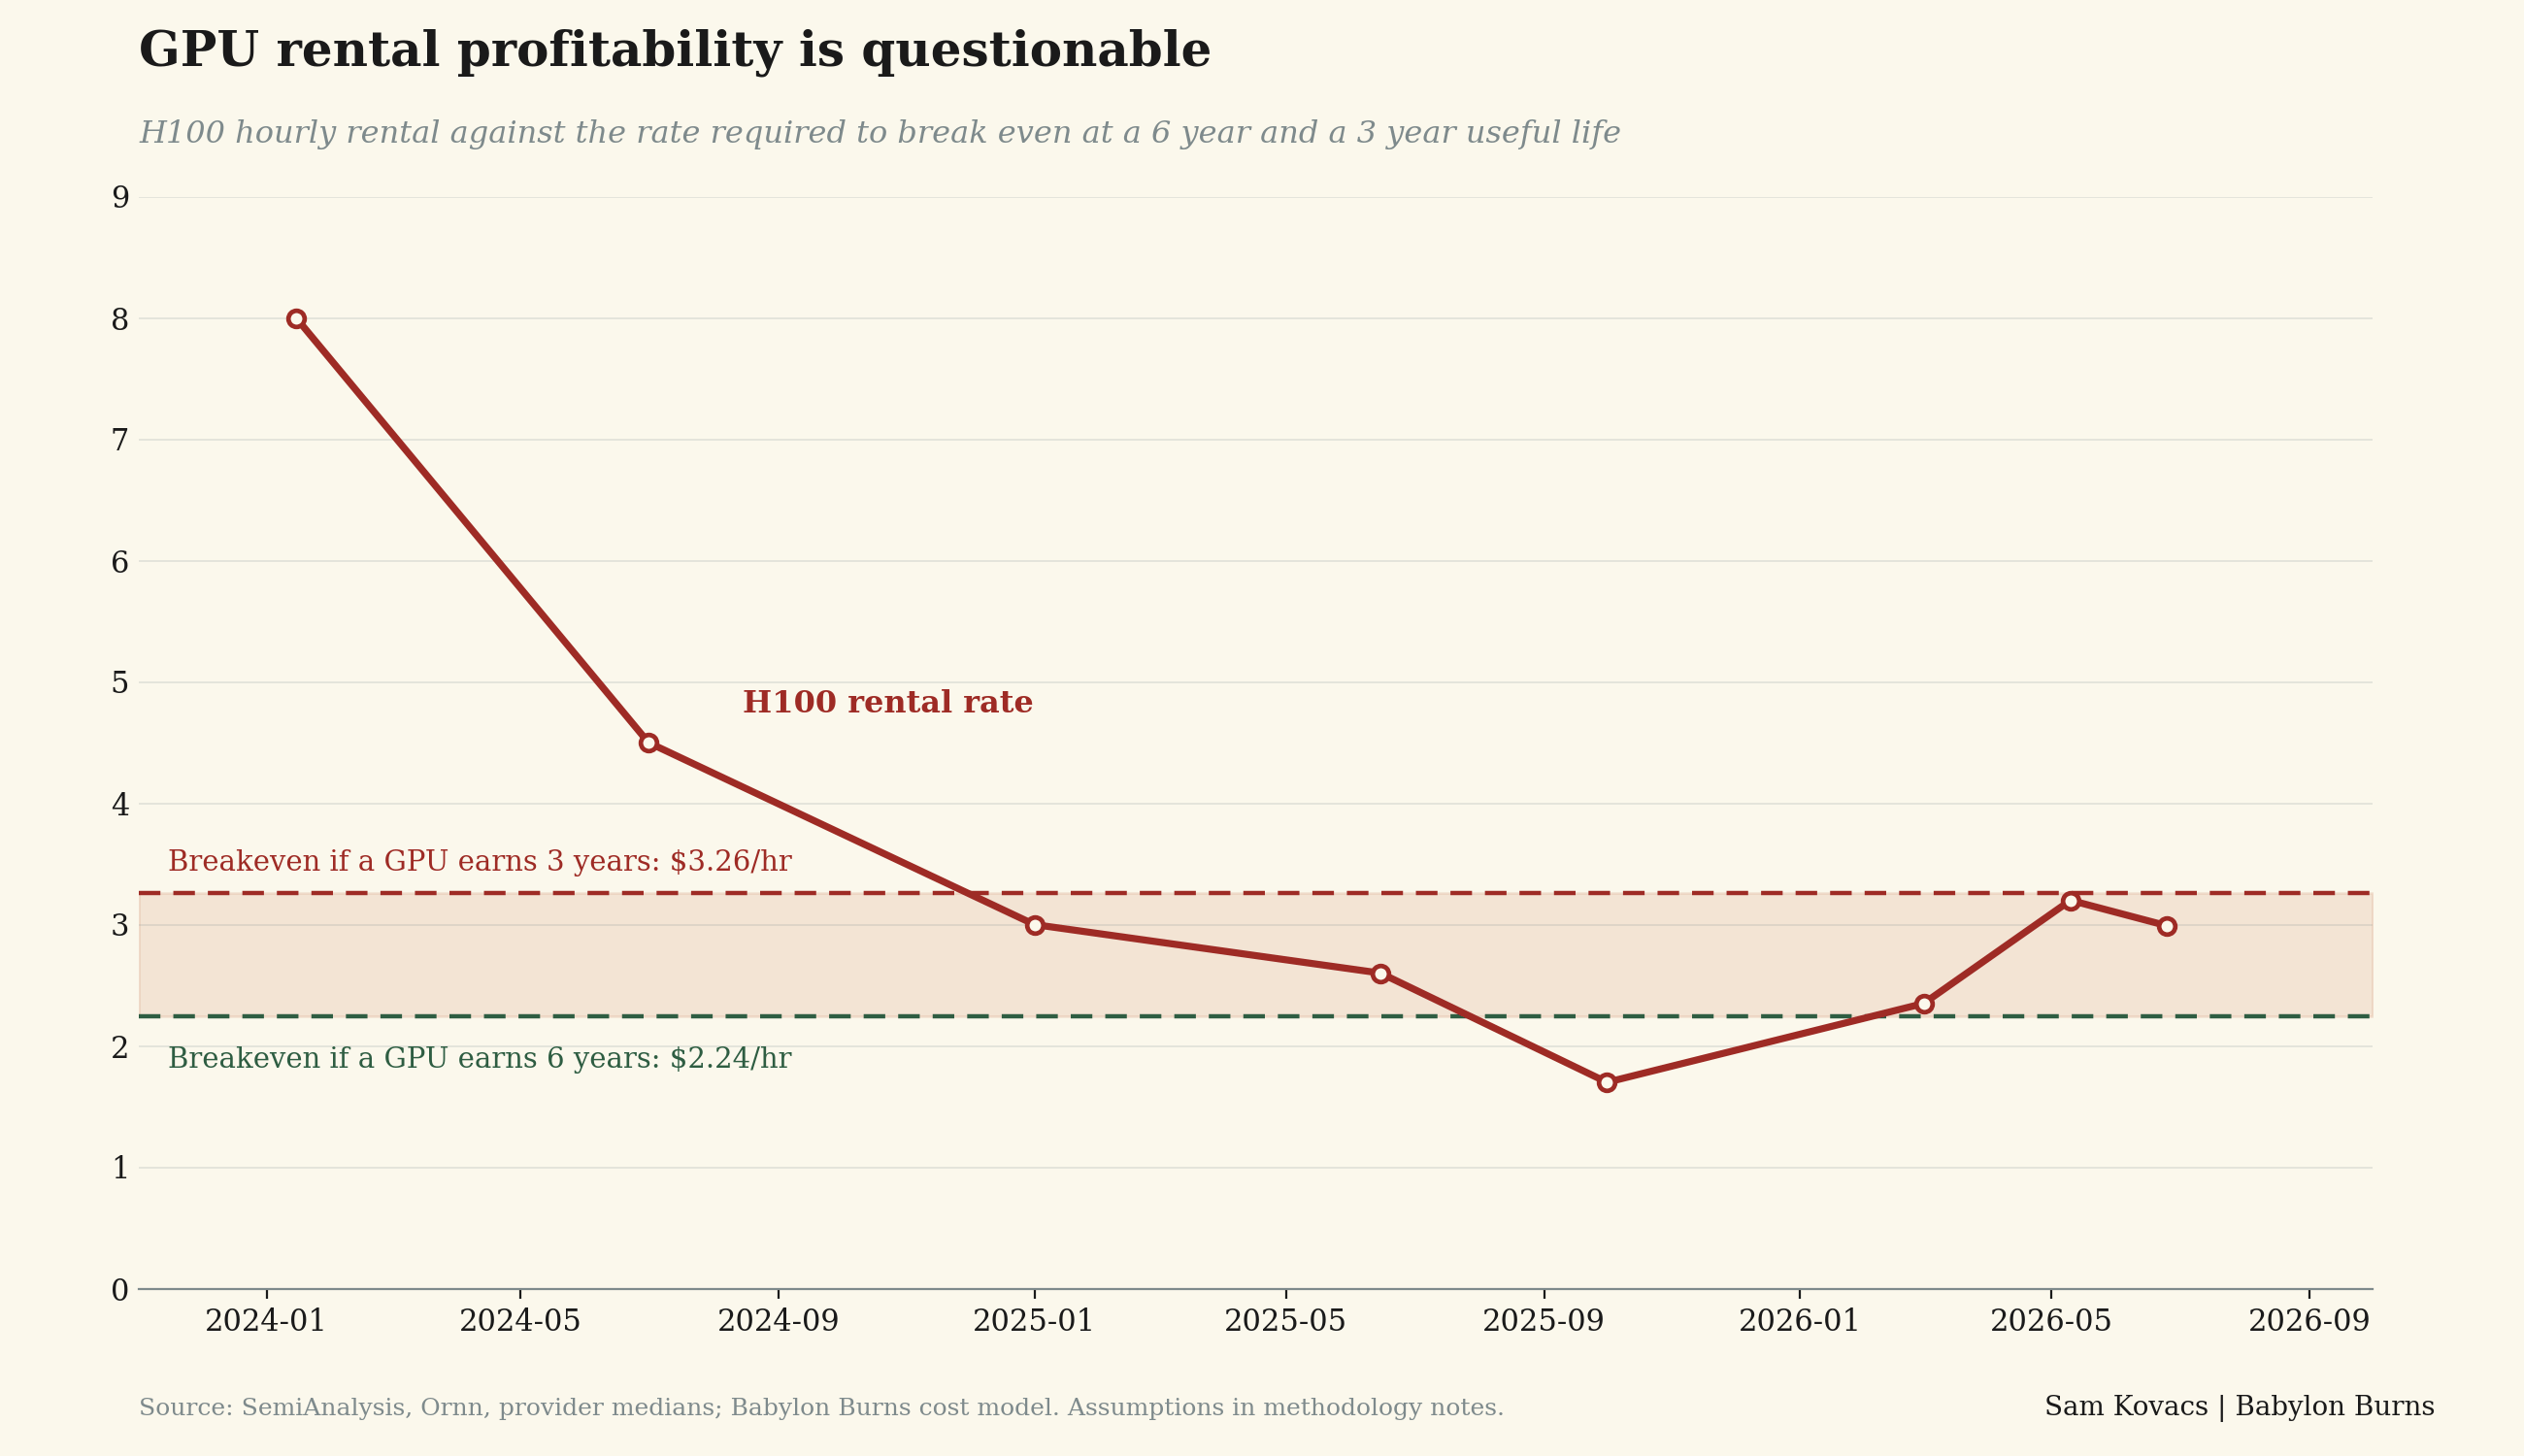
On their books, they say they will depreciate over 6 years, which makes the buildouts profitable above $2.24 per hour. The bear case has been argued for the longest by Michael Burry, who says that GPUs have an effective life of 2 to 3 years, which would make them unprofitable in any scenario.
But the market price of GPU hours is a commodity. It is a function of supply and demand, and Meta which was one of the biggest sources of demand (it has a $35bn commitment with CoreWeave) is now becoming a source of supply.
What does that tell you about where the price is going?
Beyond its $35bn CoreWeave commitment, Meta also committed $27bn at Nebius. When the customer becomes a reseller, no matter what you want to believe, you know that those contracts were the ceiling on these companies. Sure the CoreWeave contract is take or pay until 2032, but under what economics? In general CoreWeave have been discounting multi-year contracts, and have used these contracts as the collateral for the leverage they have contracted.
If the price of H100 GPUs flattens or declines with marginal demand turned marginal supply whilst the useful life of the chips is below their expectations, these guys are toast.
Nvidia is the next (circular) link.
“Turn around, Bright eyes, Every now and then I fall apart, and I need you now tonight. And I need you more than ever, and if only you hold me tight, we’ll be holding on forever, and we’ll only be making it right, cause we’ll never be wrong.”
-Bonnie Tylor, Total Eclipse of the Heart
The continuum of the already well made by others argument goes that once Hyperscaler demand flattens, Neo-Clouds buckle, then so does Nvidia, because it was not only the vendor of these chips, it was their financier.
Nvidia had committed up to $100bn to OpenAI, which it then cut 70% to $30bn just before Jensen Huang went on stage and declared it and a $10bn Anthropic stake the final direct investments made by the company.
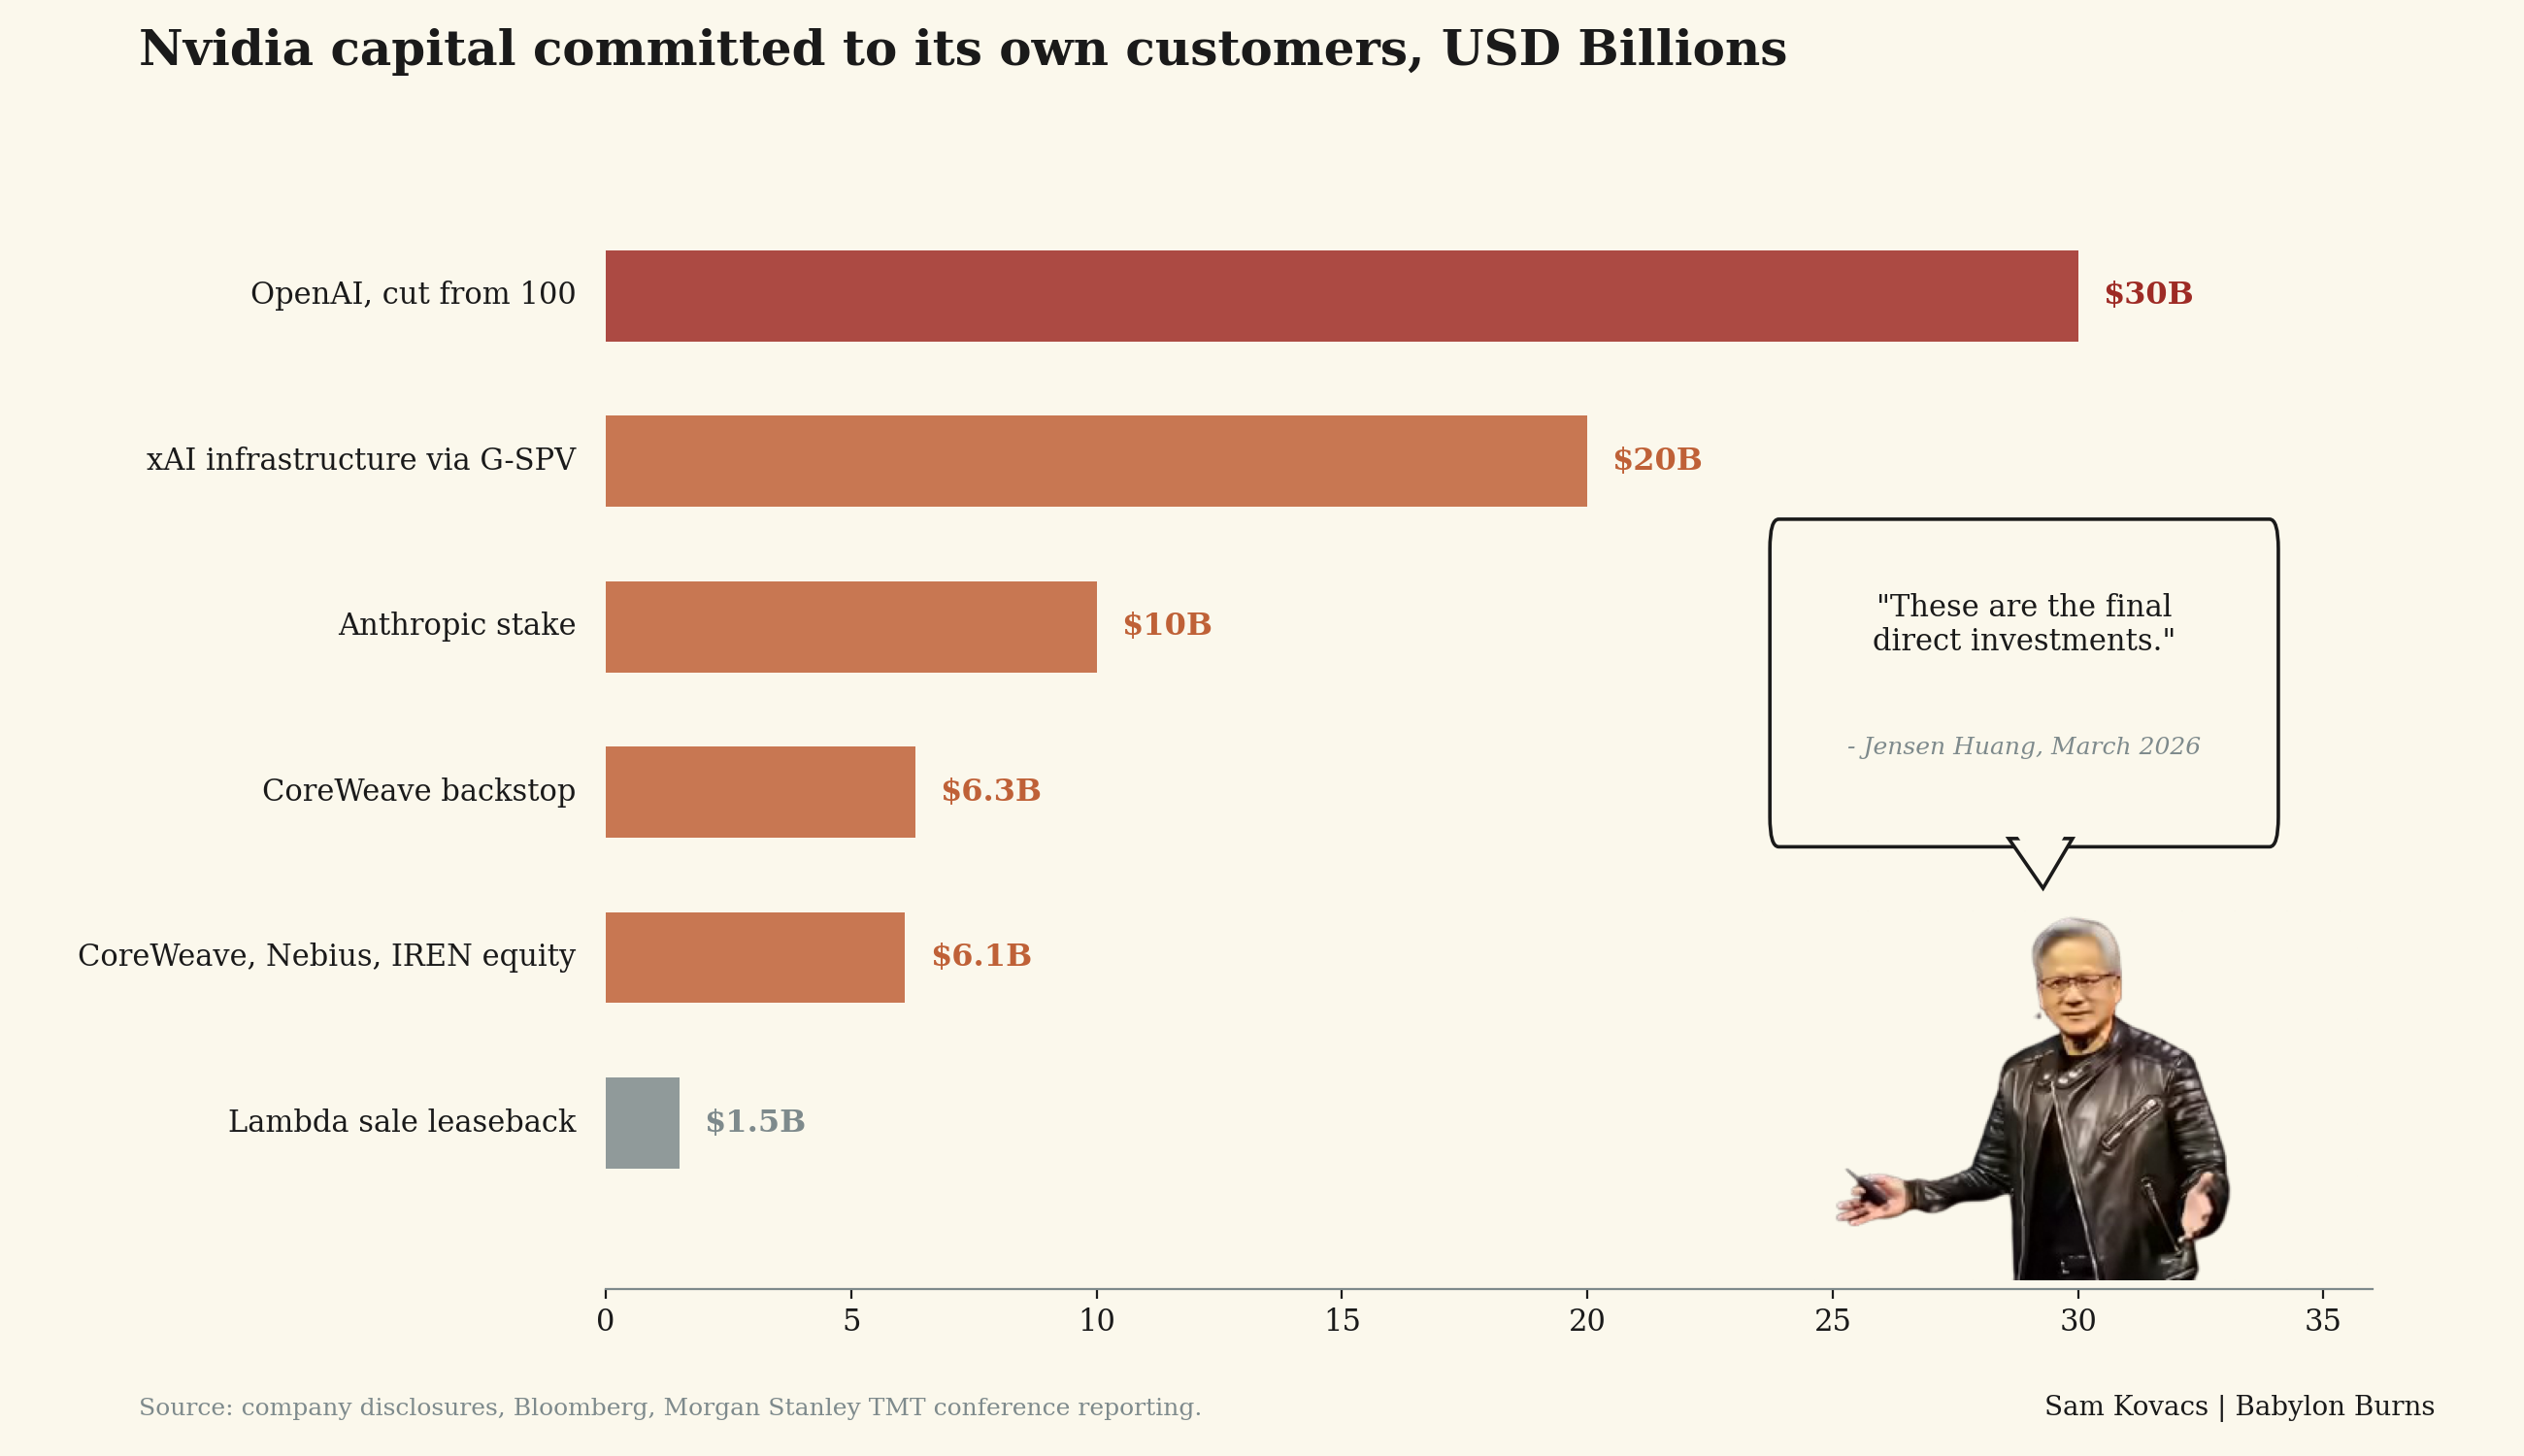
Beyond OpenAI and Anthropic, Nvidia has committed $20bn to xAI through an SPV, has arranged a $6.3bn backstop for CoreWeave stating it will rent whatever capacity they cannot fill, plus they’ve taken $2bn in equity in each of Coreweave, Nebius and IREN, plus a $1.5bn sale leaseback with Lambda in which Nvidia became its own customer’s largest customer.
Vendor financed demand is literally the lowest quality demand that exists, and they stopped doing it in March, just a quarter before one of the marquee buyers announces it has spare capacity to sell.
NVIDIA has written insurance on the utilization of its own product, which means a falling rental rate is no longer only its customers’ problem.
While I usually rebuild all chart myself with my branding, I had no interest in rebuilding the circular economy chart which would have been a nightmare.
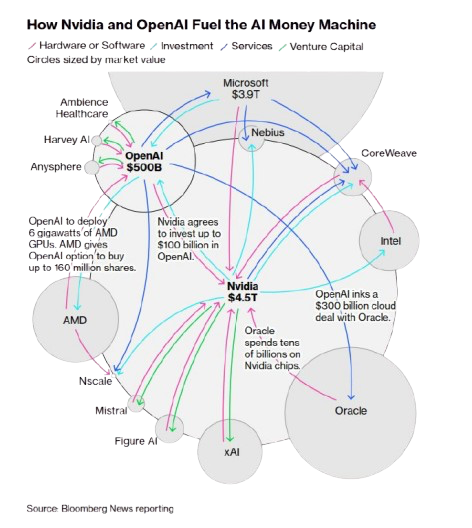
Thank you Bloomberg for the chart.
The Memory cartel gets hit next
The unwinding runs upstream to the most cyclical layer in the chain: HBM/DRAM.
The stacks of memory required alongside GPUs are built by an oligopoly: Micron ($MU), SK Hynix, and Samsung.
In a frenzied buildout, the supply has not had time to adjust, with spend on memory going from 7% of data center costs in 2023 to 30% today.
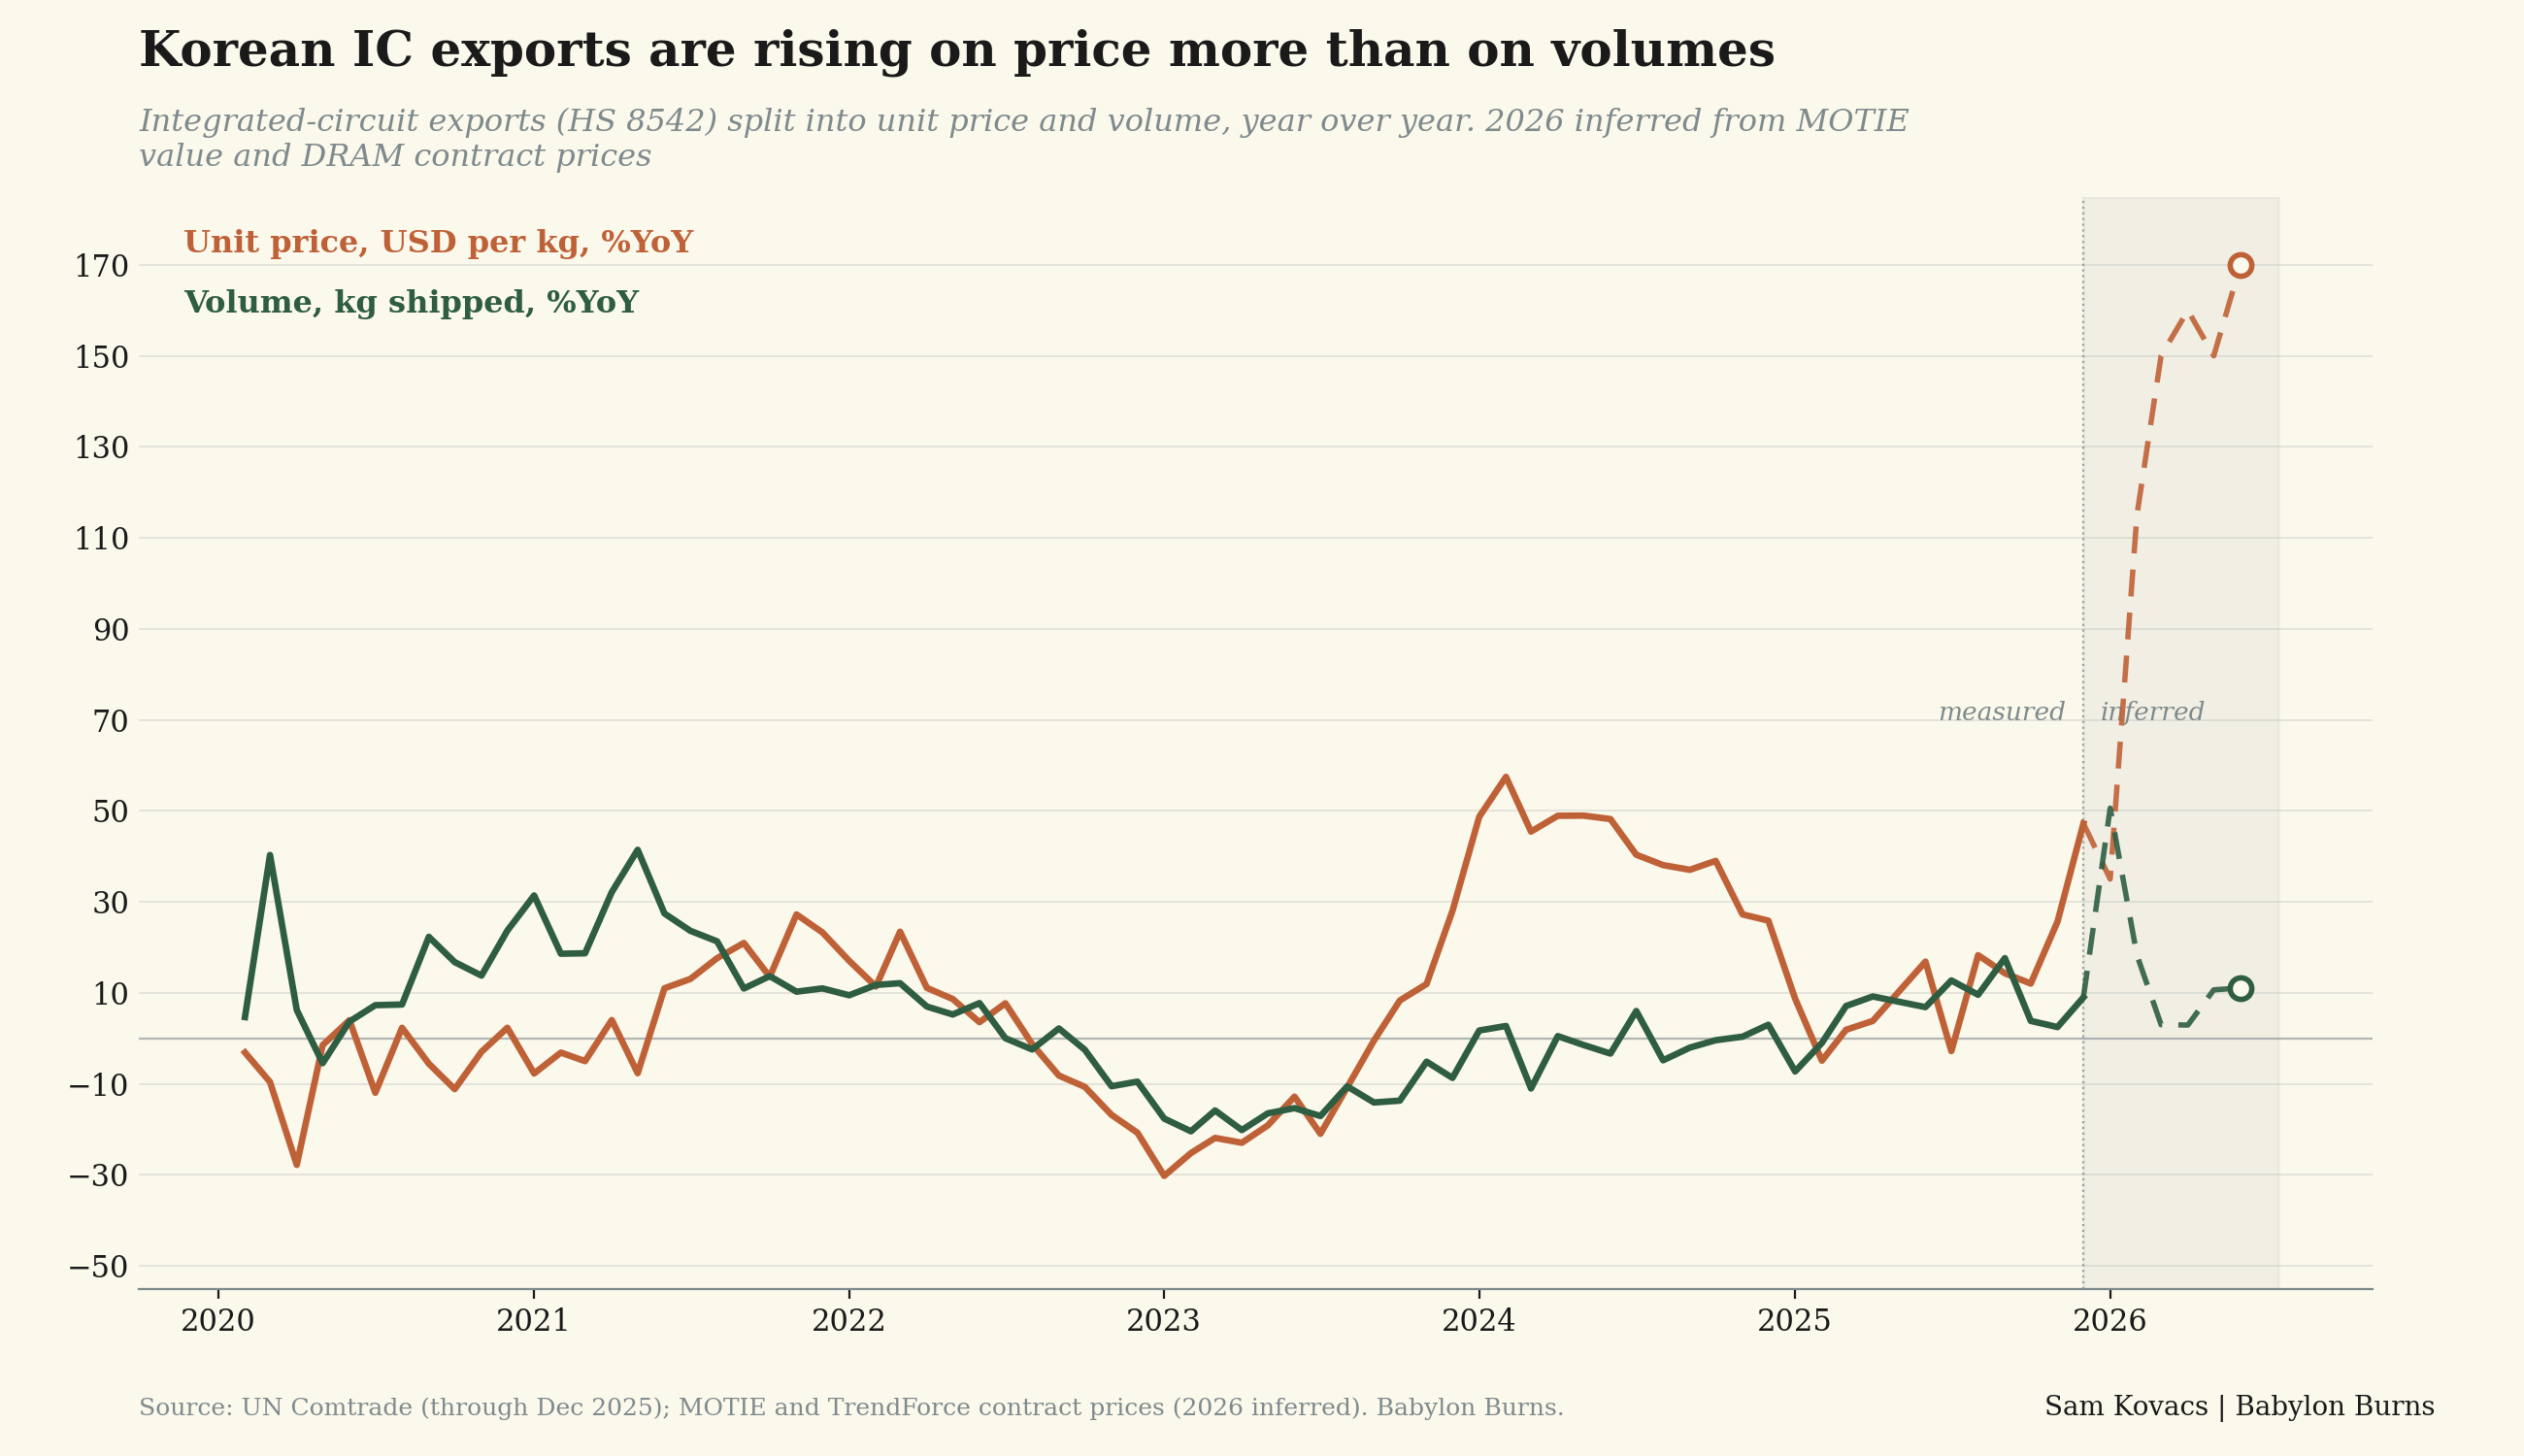
I came across an interesting chart from Andreas Steno Larson the other day which showed YoY growth in Korean exports as a decent coincident indicator for semiconductor stock prices. I built it adding on the forecast of Korean semiconductor exports going forward.
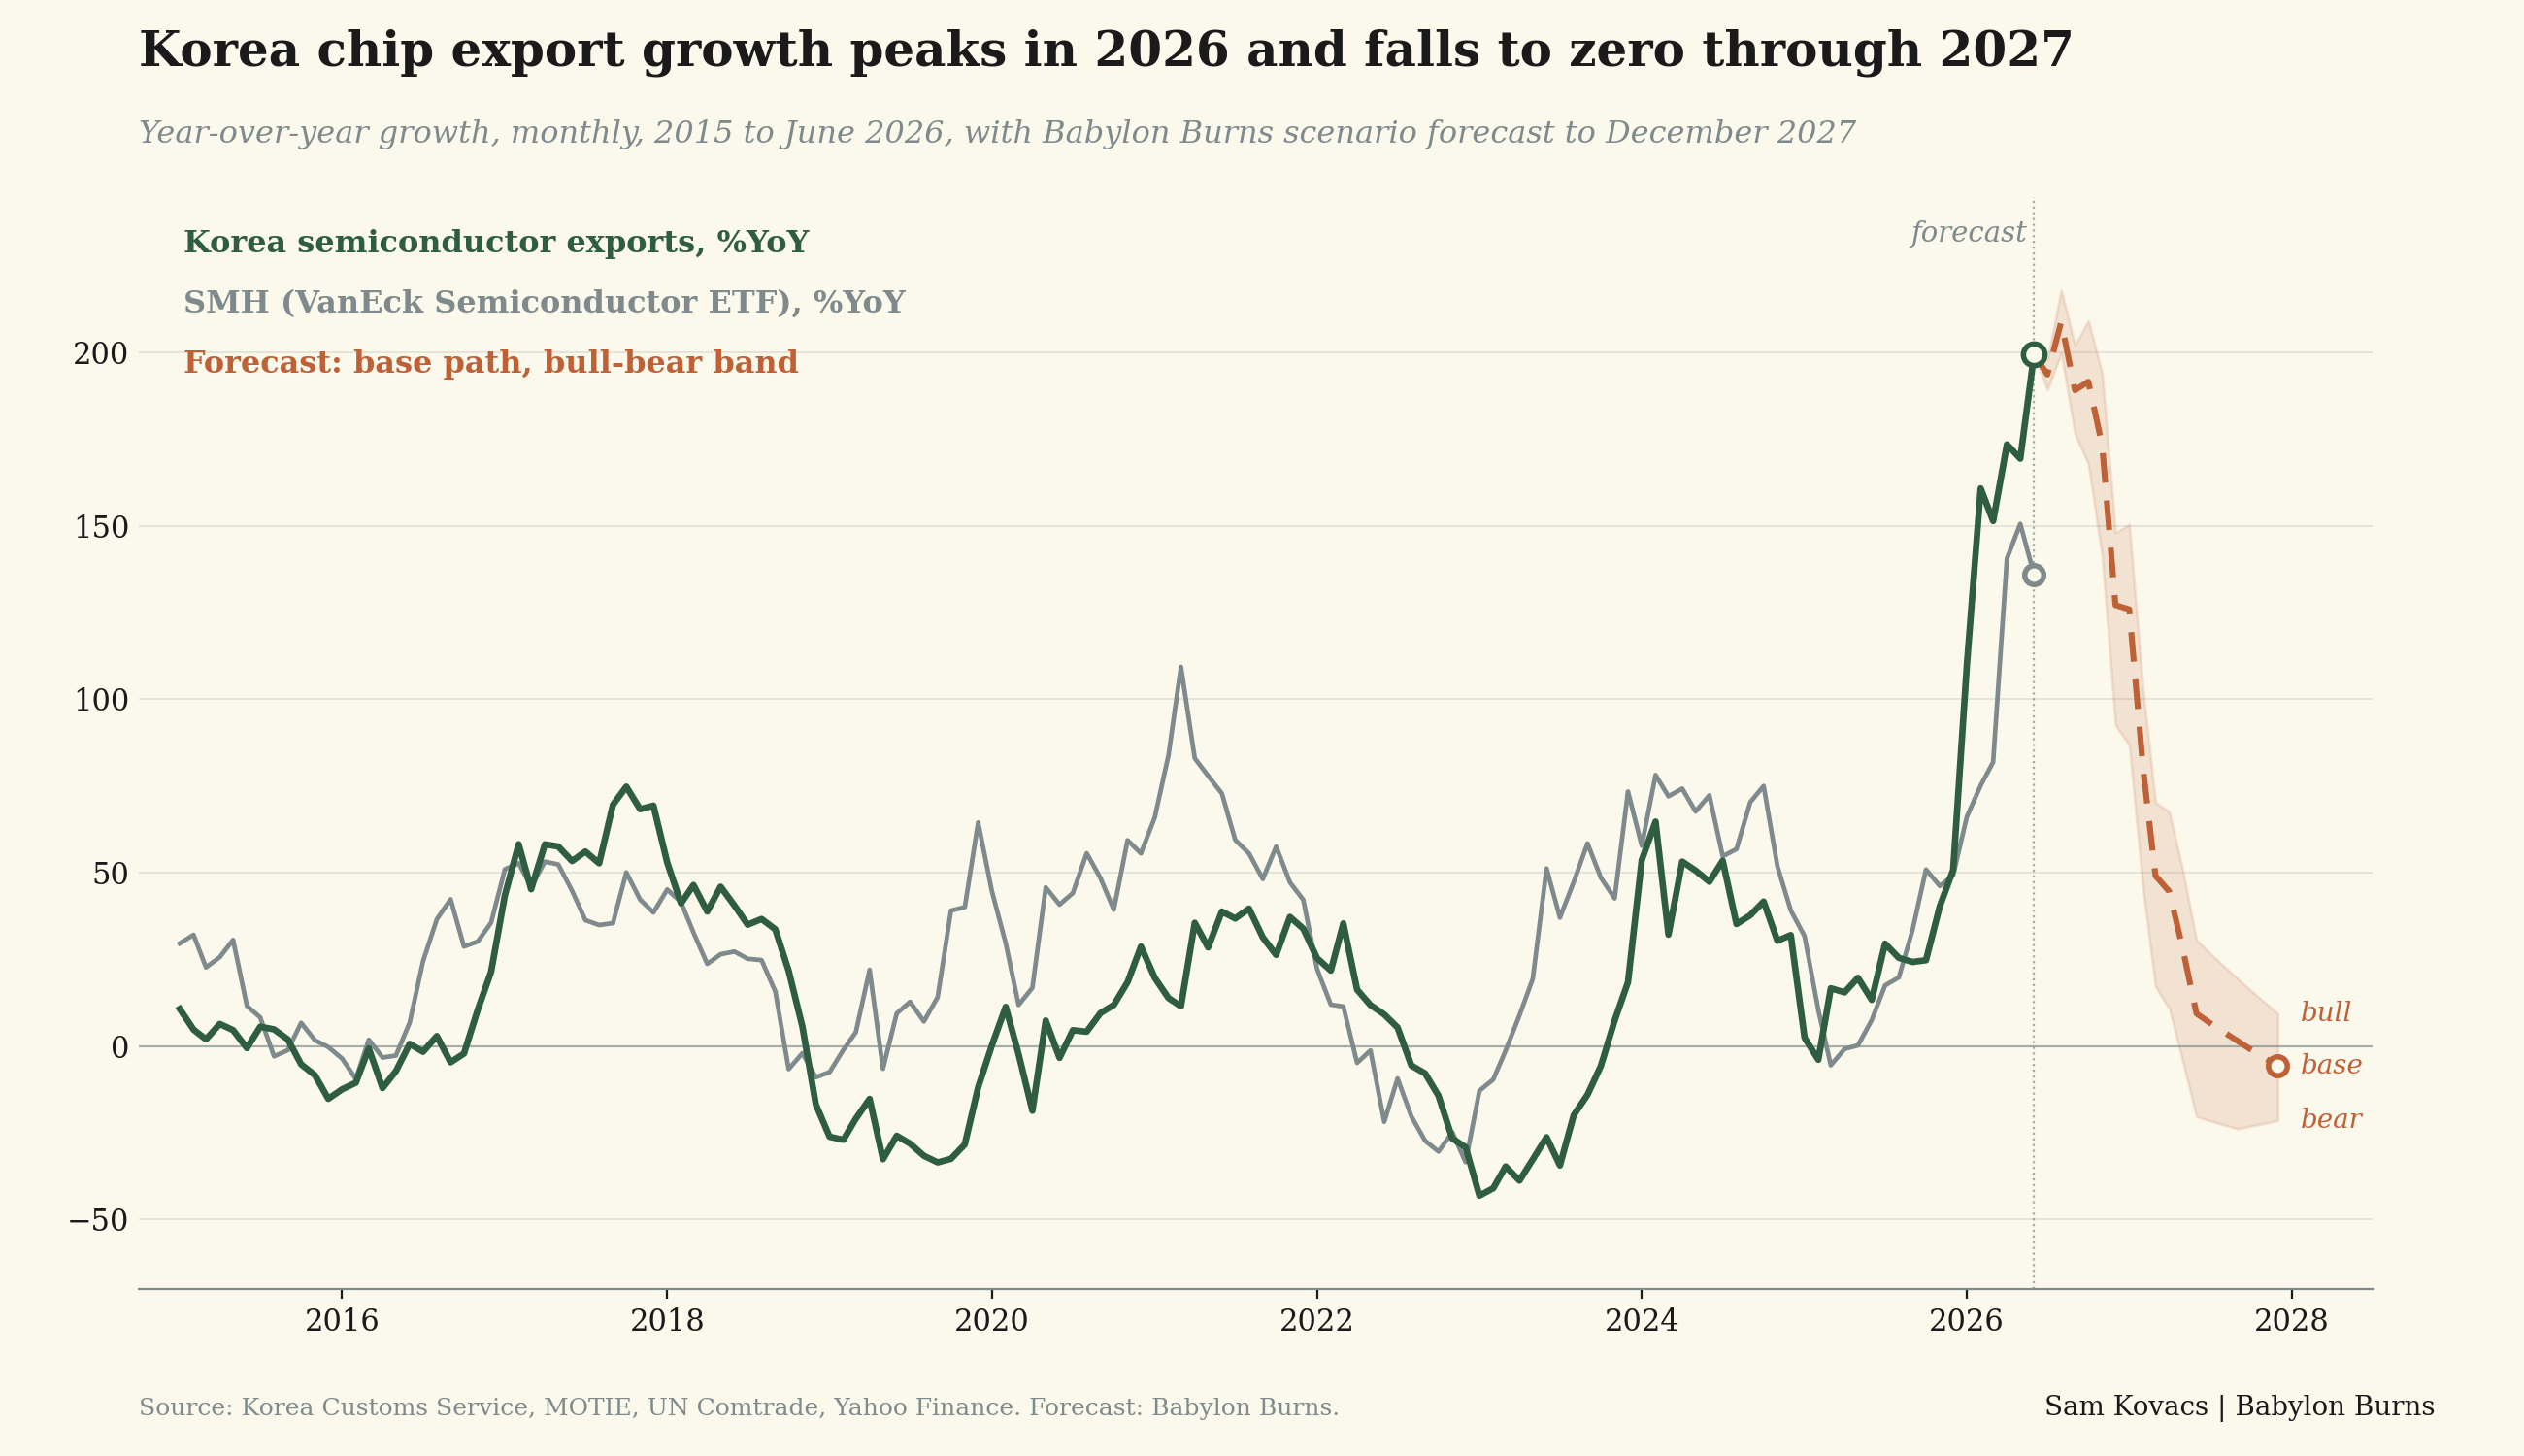
These charts are cute until they decouple (remember the global M2 and Bitcoin chart?), and the decoupling usually comes to the downside when the stocks turn more negative than the exports.
Nonetheless they do bring up an interesting discussion point, which is that assuming fixed prices, given that we know the supply is pretty much fixed until late 2027, then the arithmetic suggests that the growth rate in Korean exports must peak between now and October. After that the arithmetic just doesn’t support it.
The price curve after having undergone some dramatic changes, is now showing signs of flattening for DRAM, HBM, and NAND (to a lesser extent)
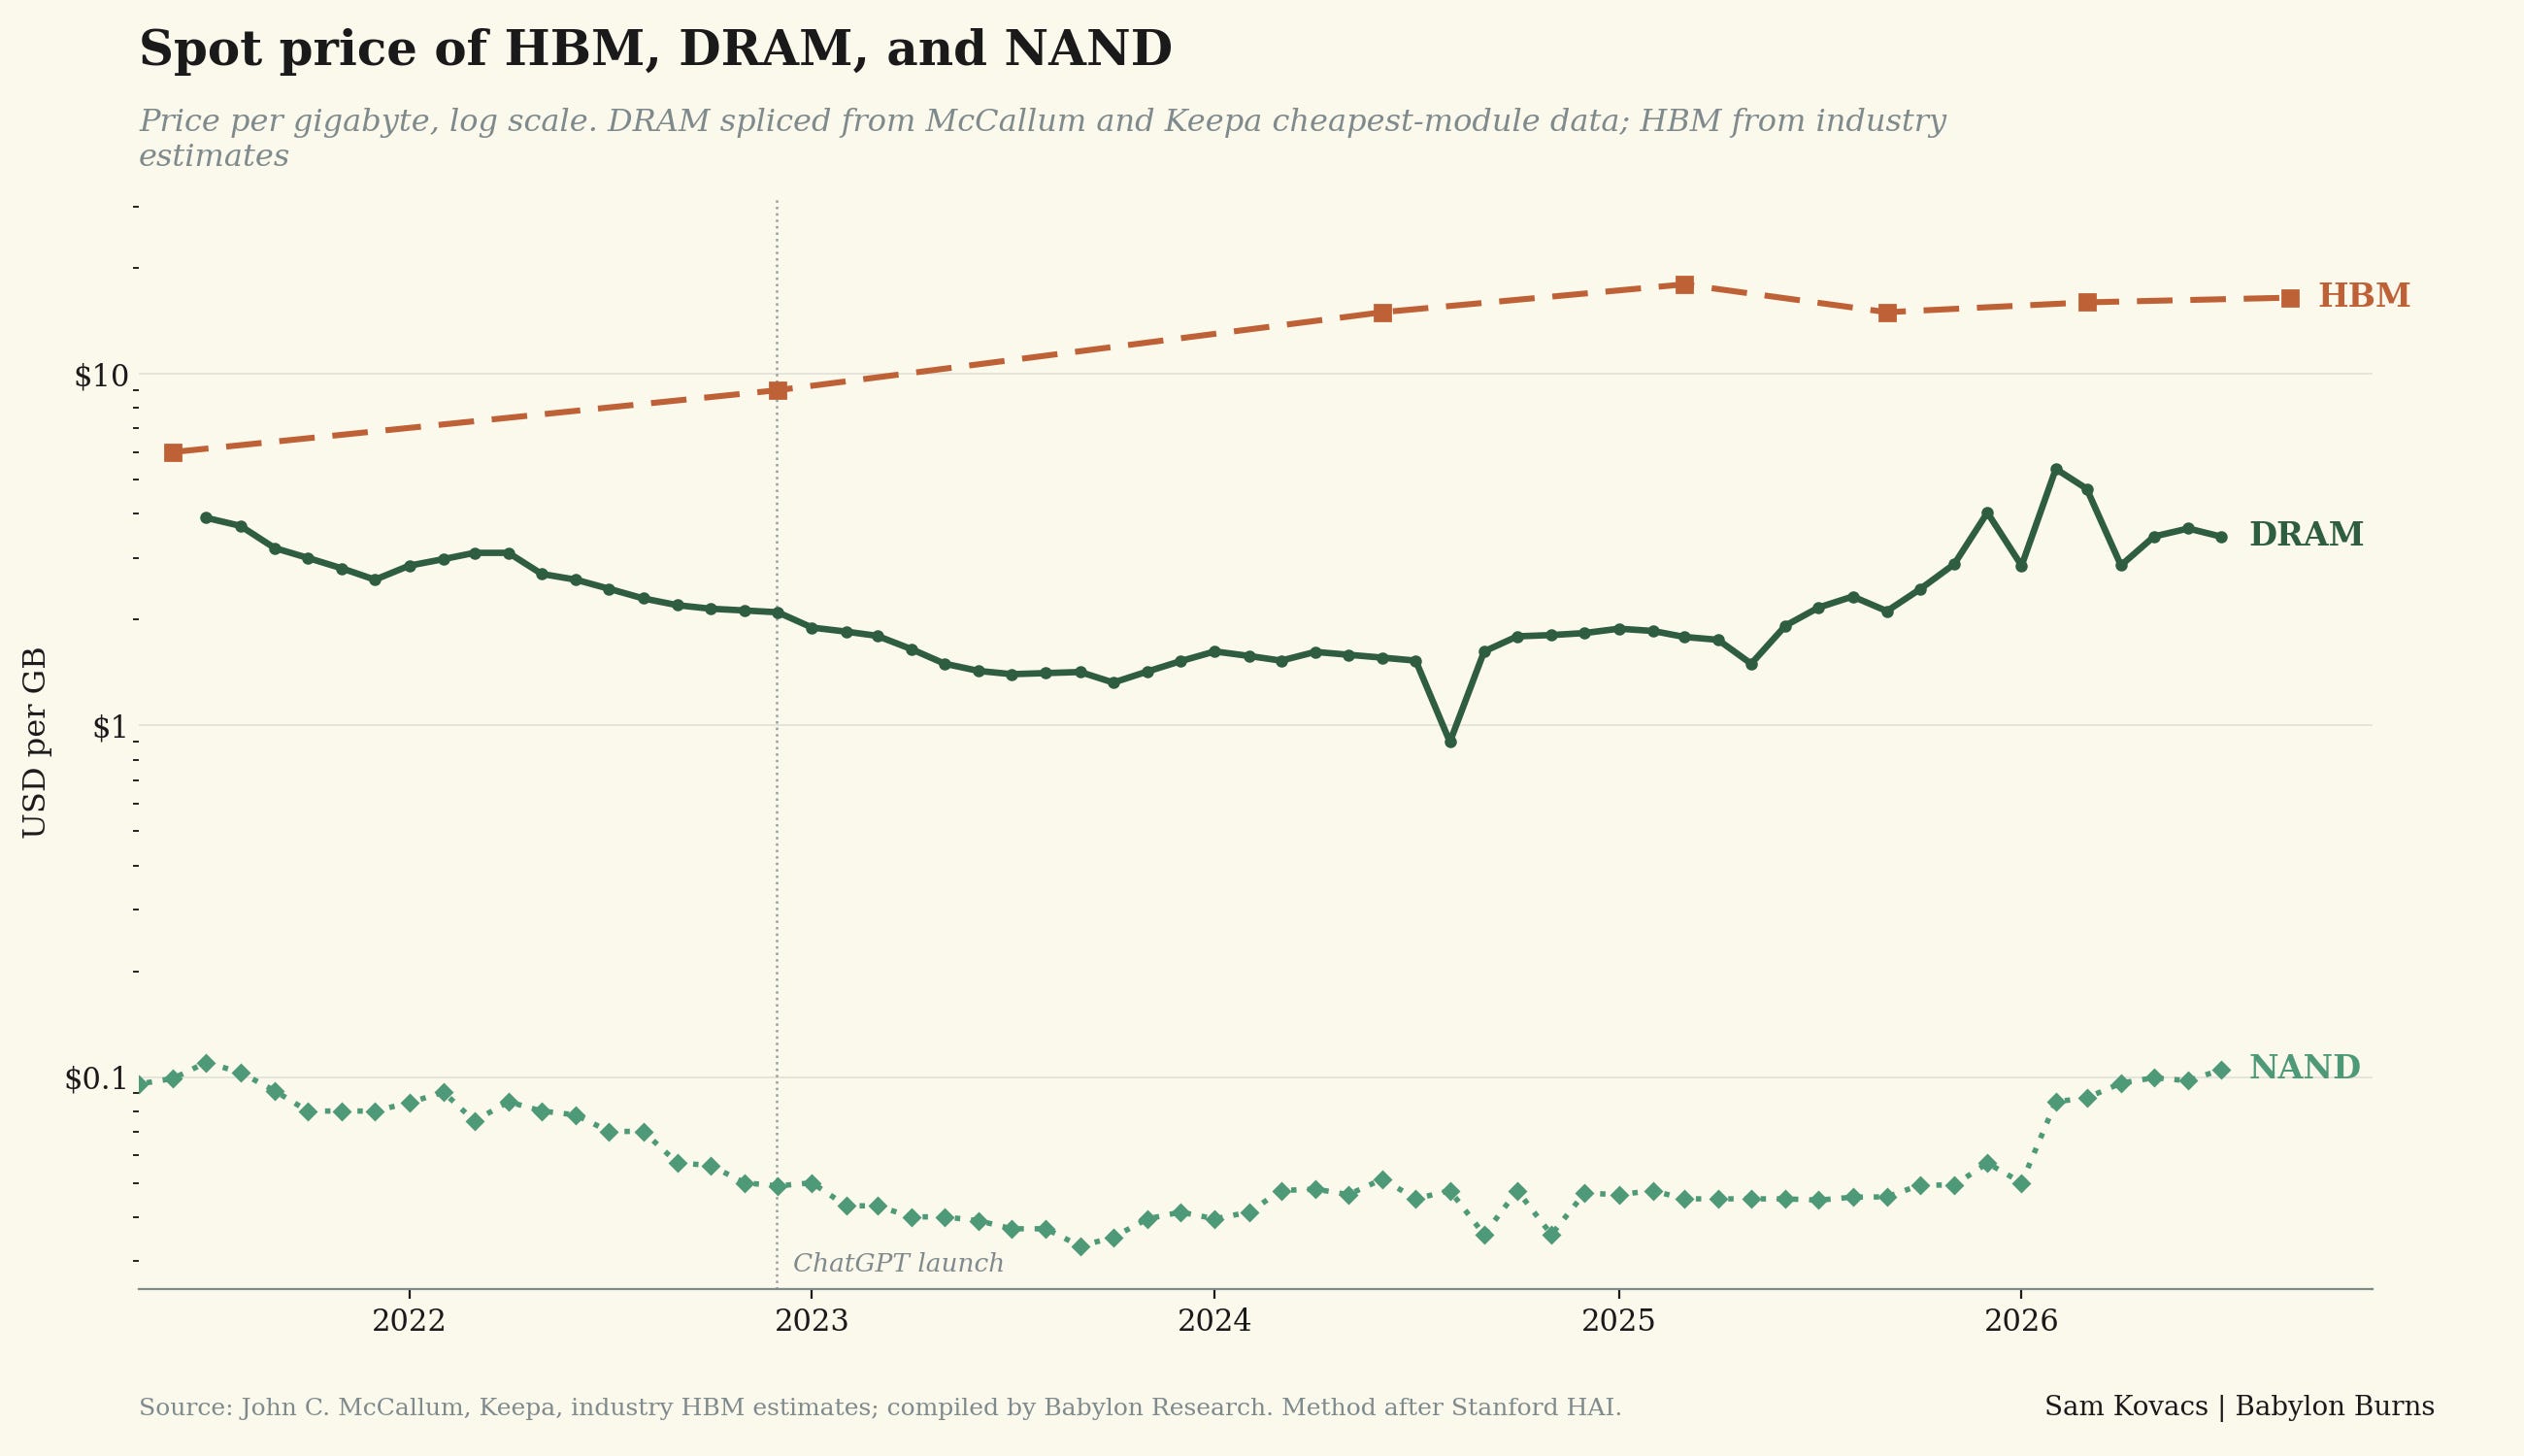
I will not pretend to be able to pinpoint a peak in contracted pricing, but matching a growth rate is a difficult thing to do.
As we roll over into higher comparables, it gets harder to put up crazy YoY growth numbers. As the growth numbers come down, so do the expectations, so do the valuations.
And in 2027 and 2028, new fabs are coming online, which tells us there is a light at the end of the shortage tunnel.
Unfortunately for the stock prices, that light might be freight train hurling towards them.
The hyperscalers come last
Unlike the neo-clouds, the hyperscalers do not face a solvency question, since they’ve been funding the buildout from some of the largest profit streams in the history of capitalism.
The problem is if the returns don’t live up to the demand, then they will be left with investments which will not produce the returns that are expected over assets which depreciate probably quite quickly.
What we’re going to look for are the first indications that CapEx is flattening or declining, but this will of course be a lagging indicator.
If the returns don’t come from the CapEx, these firms will cut the CapEx to protect their cashflows, after having turned them negative in the build-up.
This will necessarily come with an unwinding of prices, but it might be less extreme in scale than in the layers above.
Reading the tea leaves
This brings our analysis of the future chain of events to an end, which brings me to the usual conclusion:
“Cool Story Sam, but what do the charts say?”
I believe the validity of classic technical charting is now well established. I tend to keep my analysis simple, abiding to the principles which Schabacker set out in the 1930s.
Back then he posited that charts show us “the balance between buyers and sellers, the balance between supply and demand for any stock or group of stocks; in short the phenomena arising out of actual trading, per se, in a free and open market."
I agree. Price is a log of how buyers and sellers felt about all known factors. In price we see exuberance, trends, exhaustion and reversals.
I am not a pure chartist, my approach is one of confluence. Do the numbers, the narrative, and the public log (price chart) of the events converge in the same direction?
With the necessary lip-service to technicals out of the way, let’s proceed. I will be looking at charts at various time horizons and asking: what do they tell us collectively?
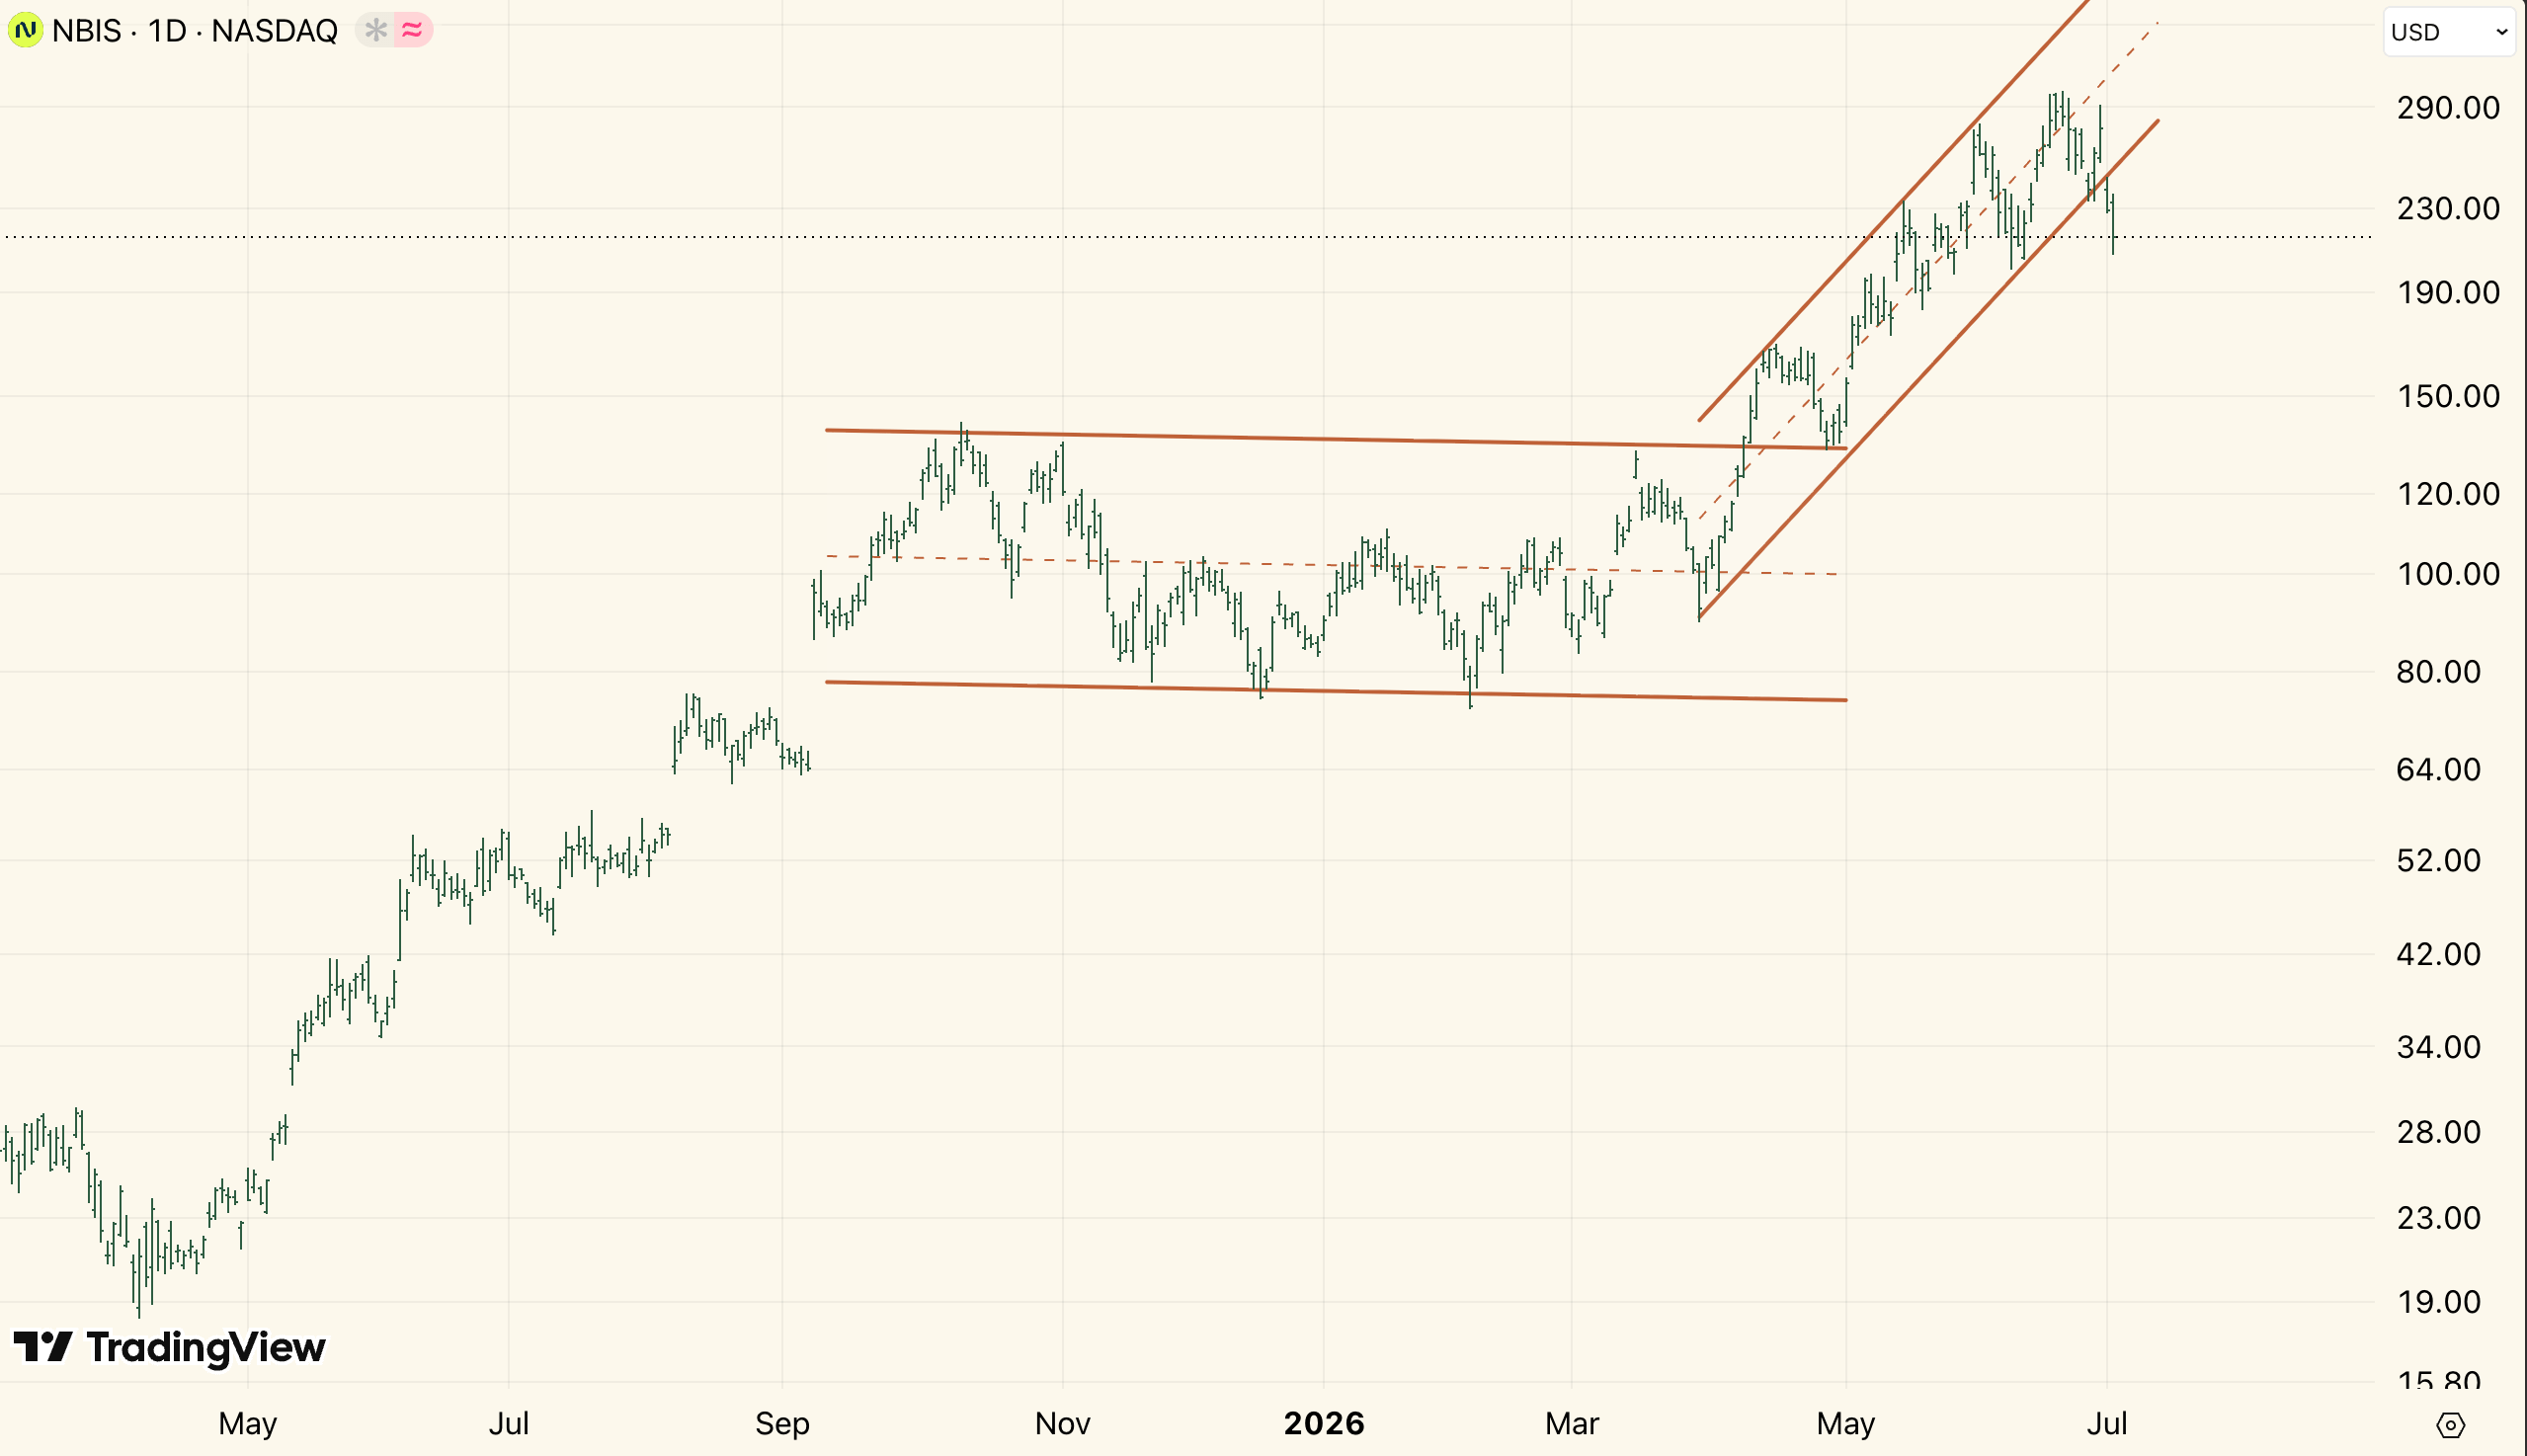
The Neo-clouds, whose business is to finance compute with debt and sell it to the hyperscalers like Meta, saw horrendous price action on Wednesday and Thursday.
Nebius Group ($NBIS) fell from $258 to $215, falling out of its 2026 ascending channel in the process, flipping the trend negative.
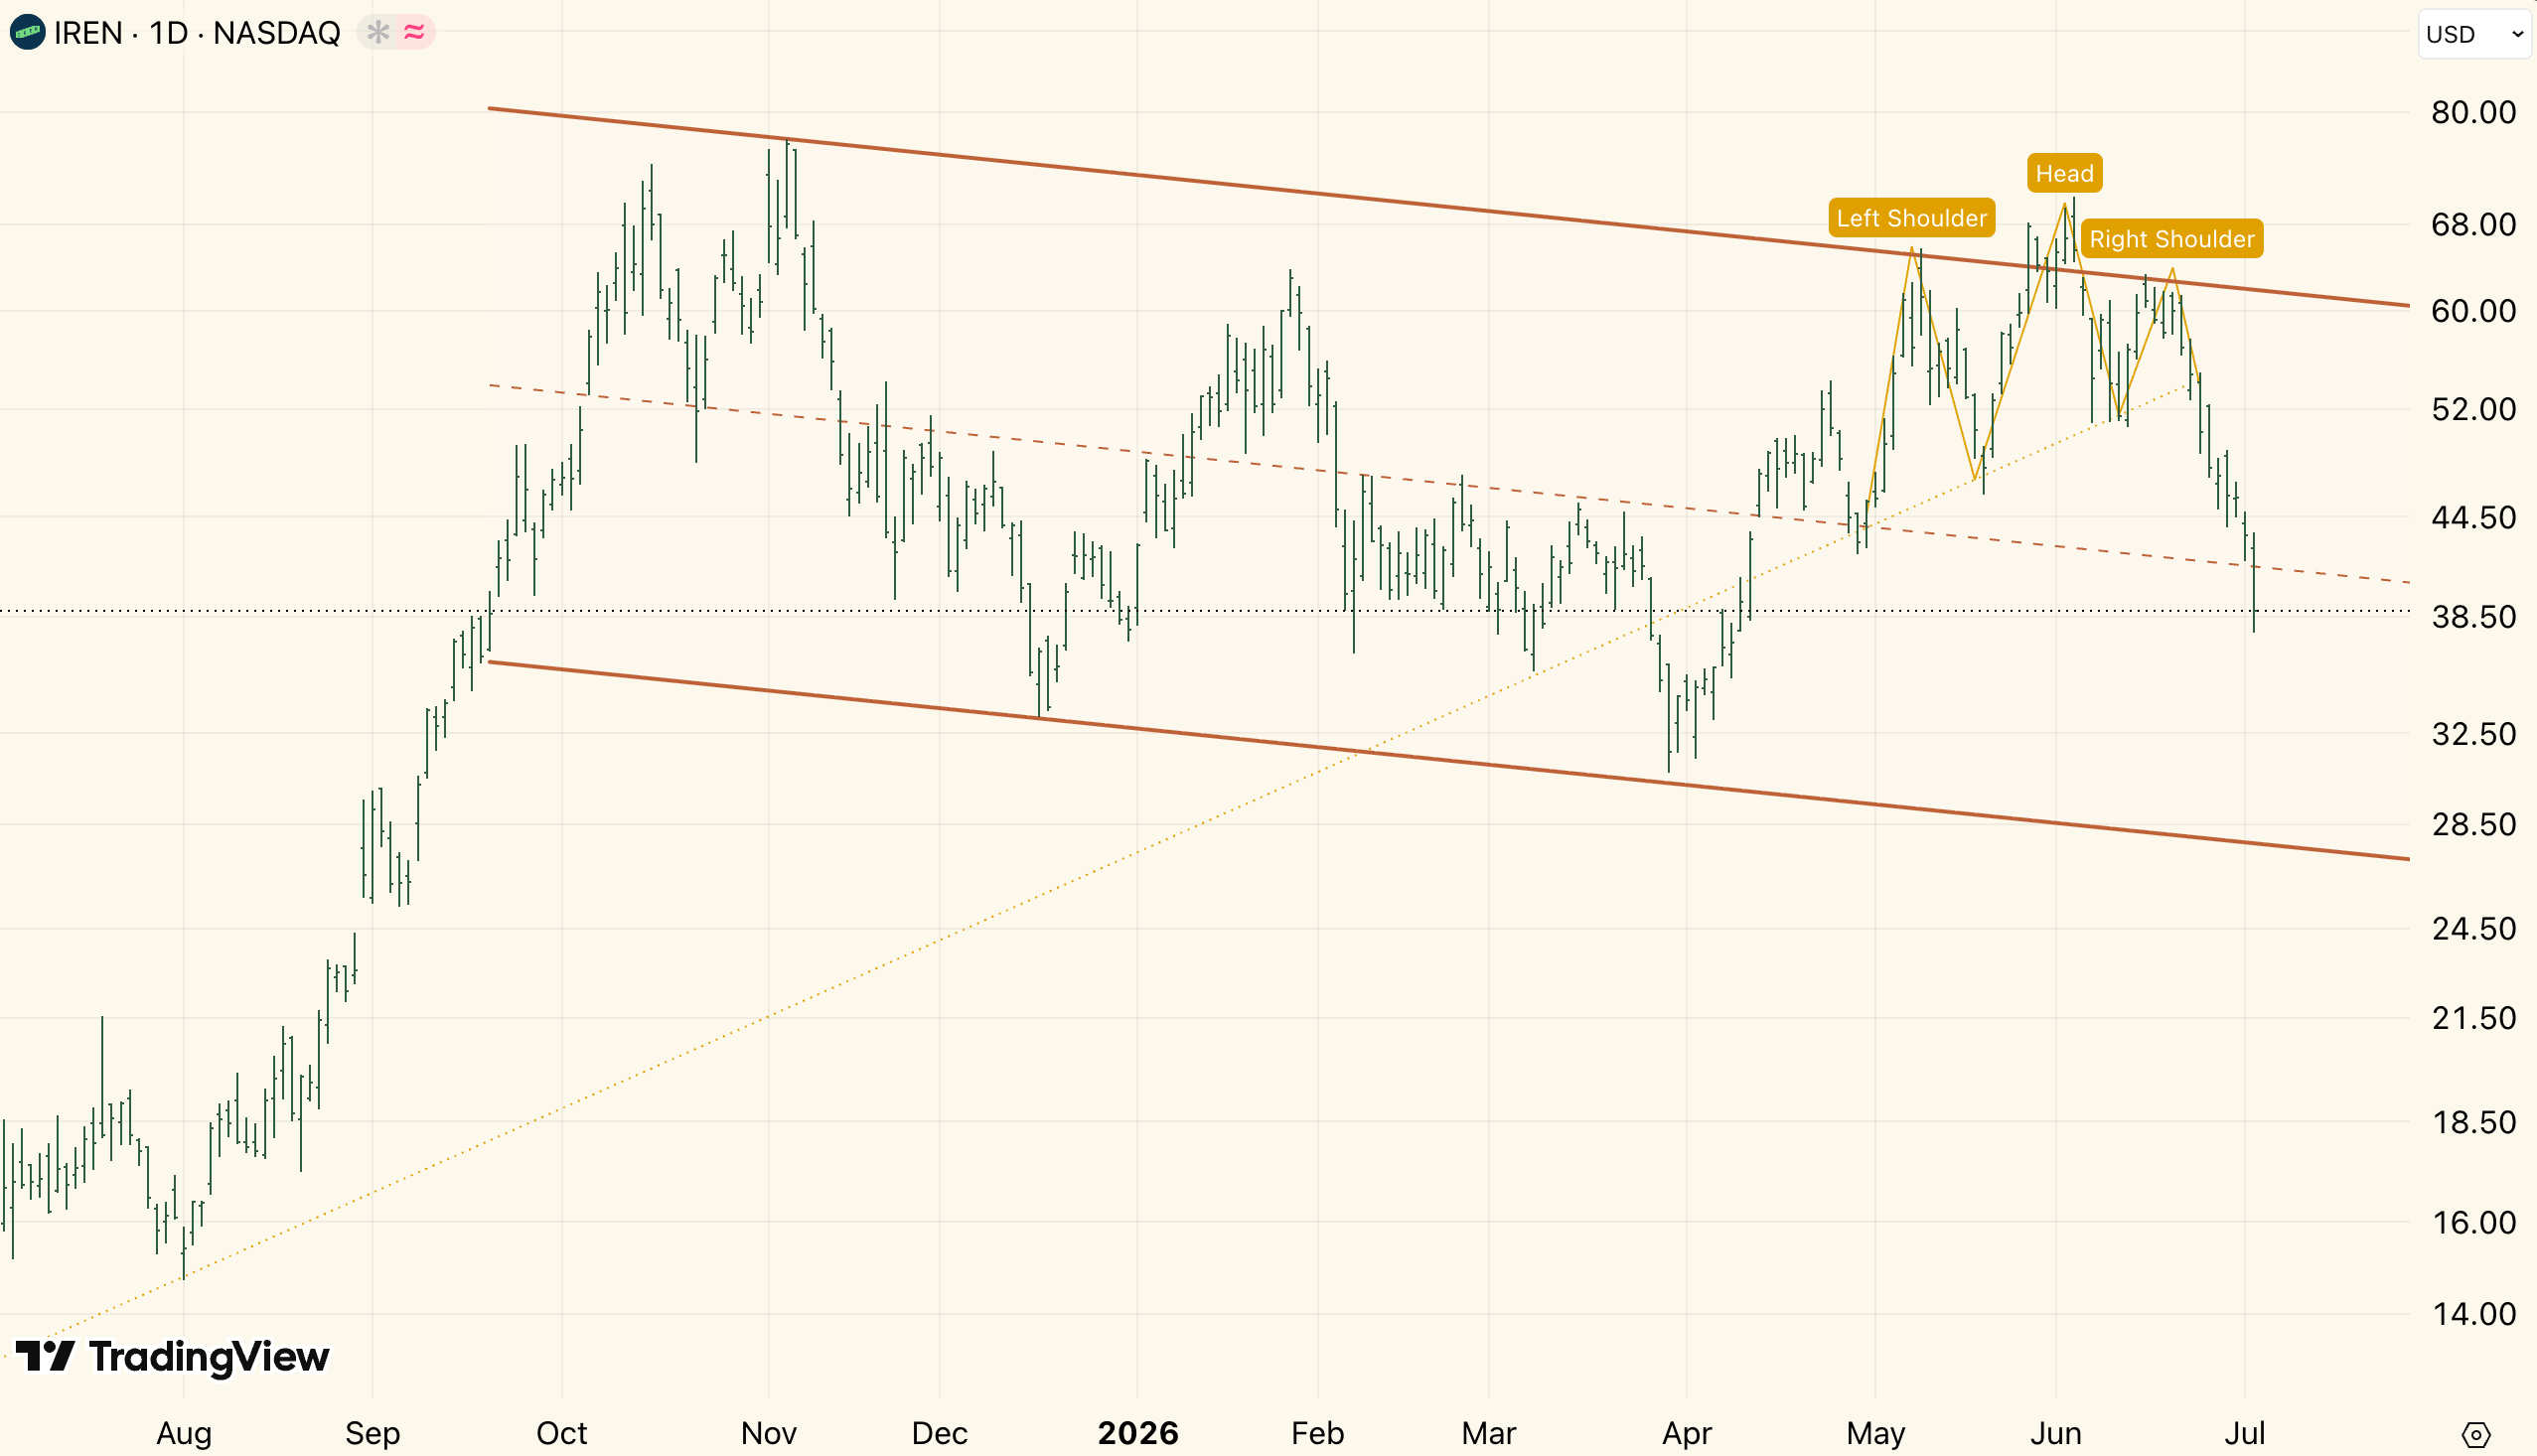
IREN ($IREN), the converted miner, completed a head and shoulders pattern which confirmed the reversal on June 24th. It continued its descent from $45 a couple days ago to $38. The default target from his is a retest of $27.
Coreweave ($CRWV) which in April had staged a breakout following 3 quarters of consolidation, broke back down during the two trading sessions.
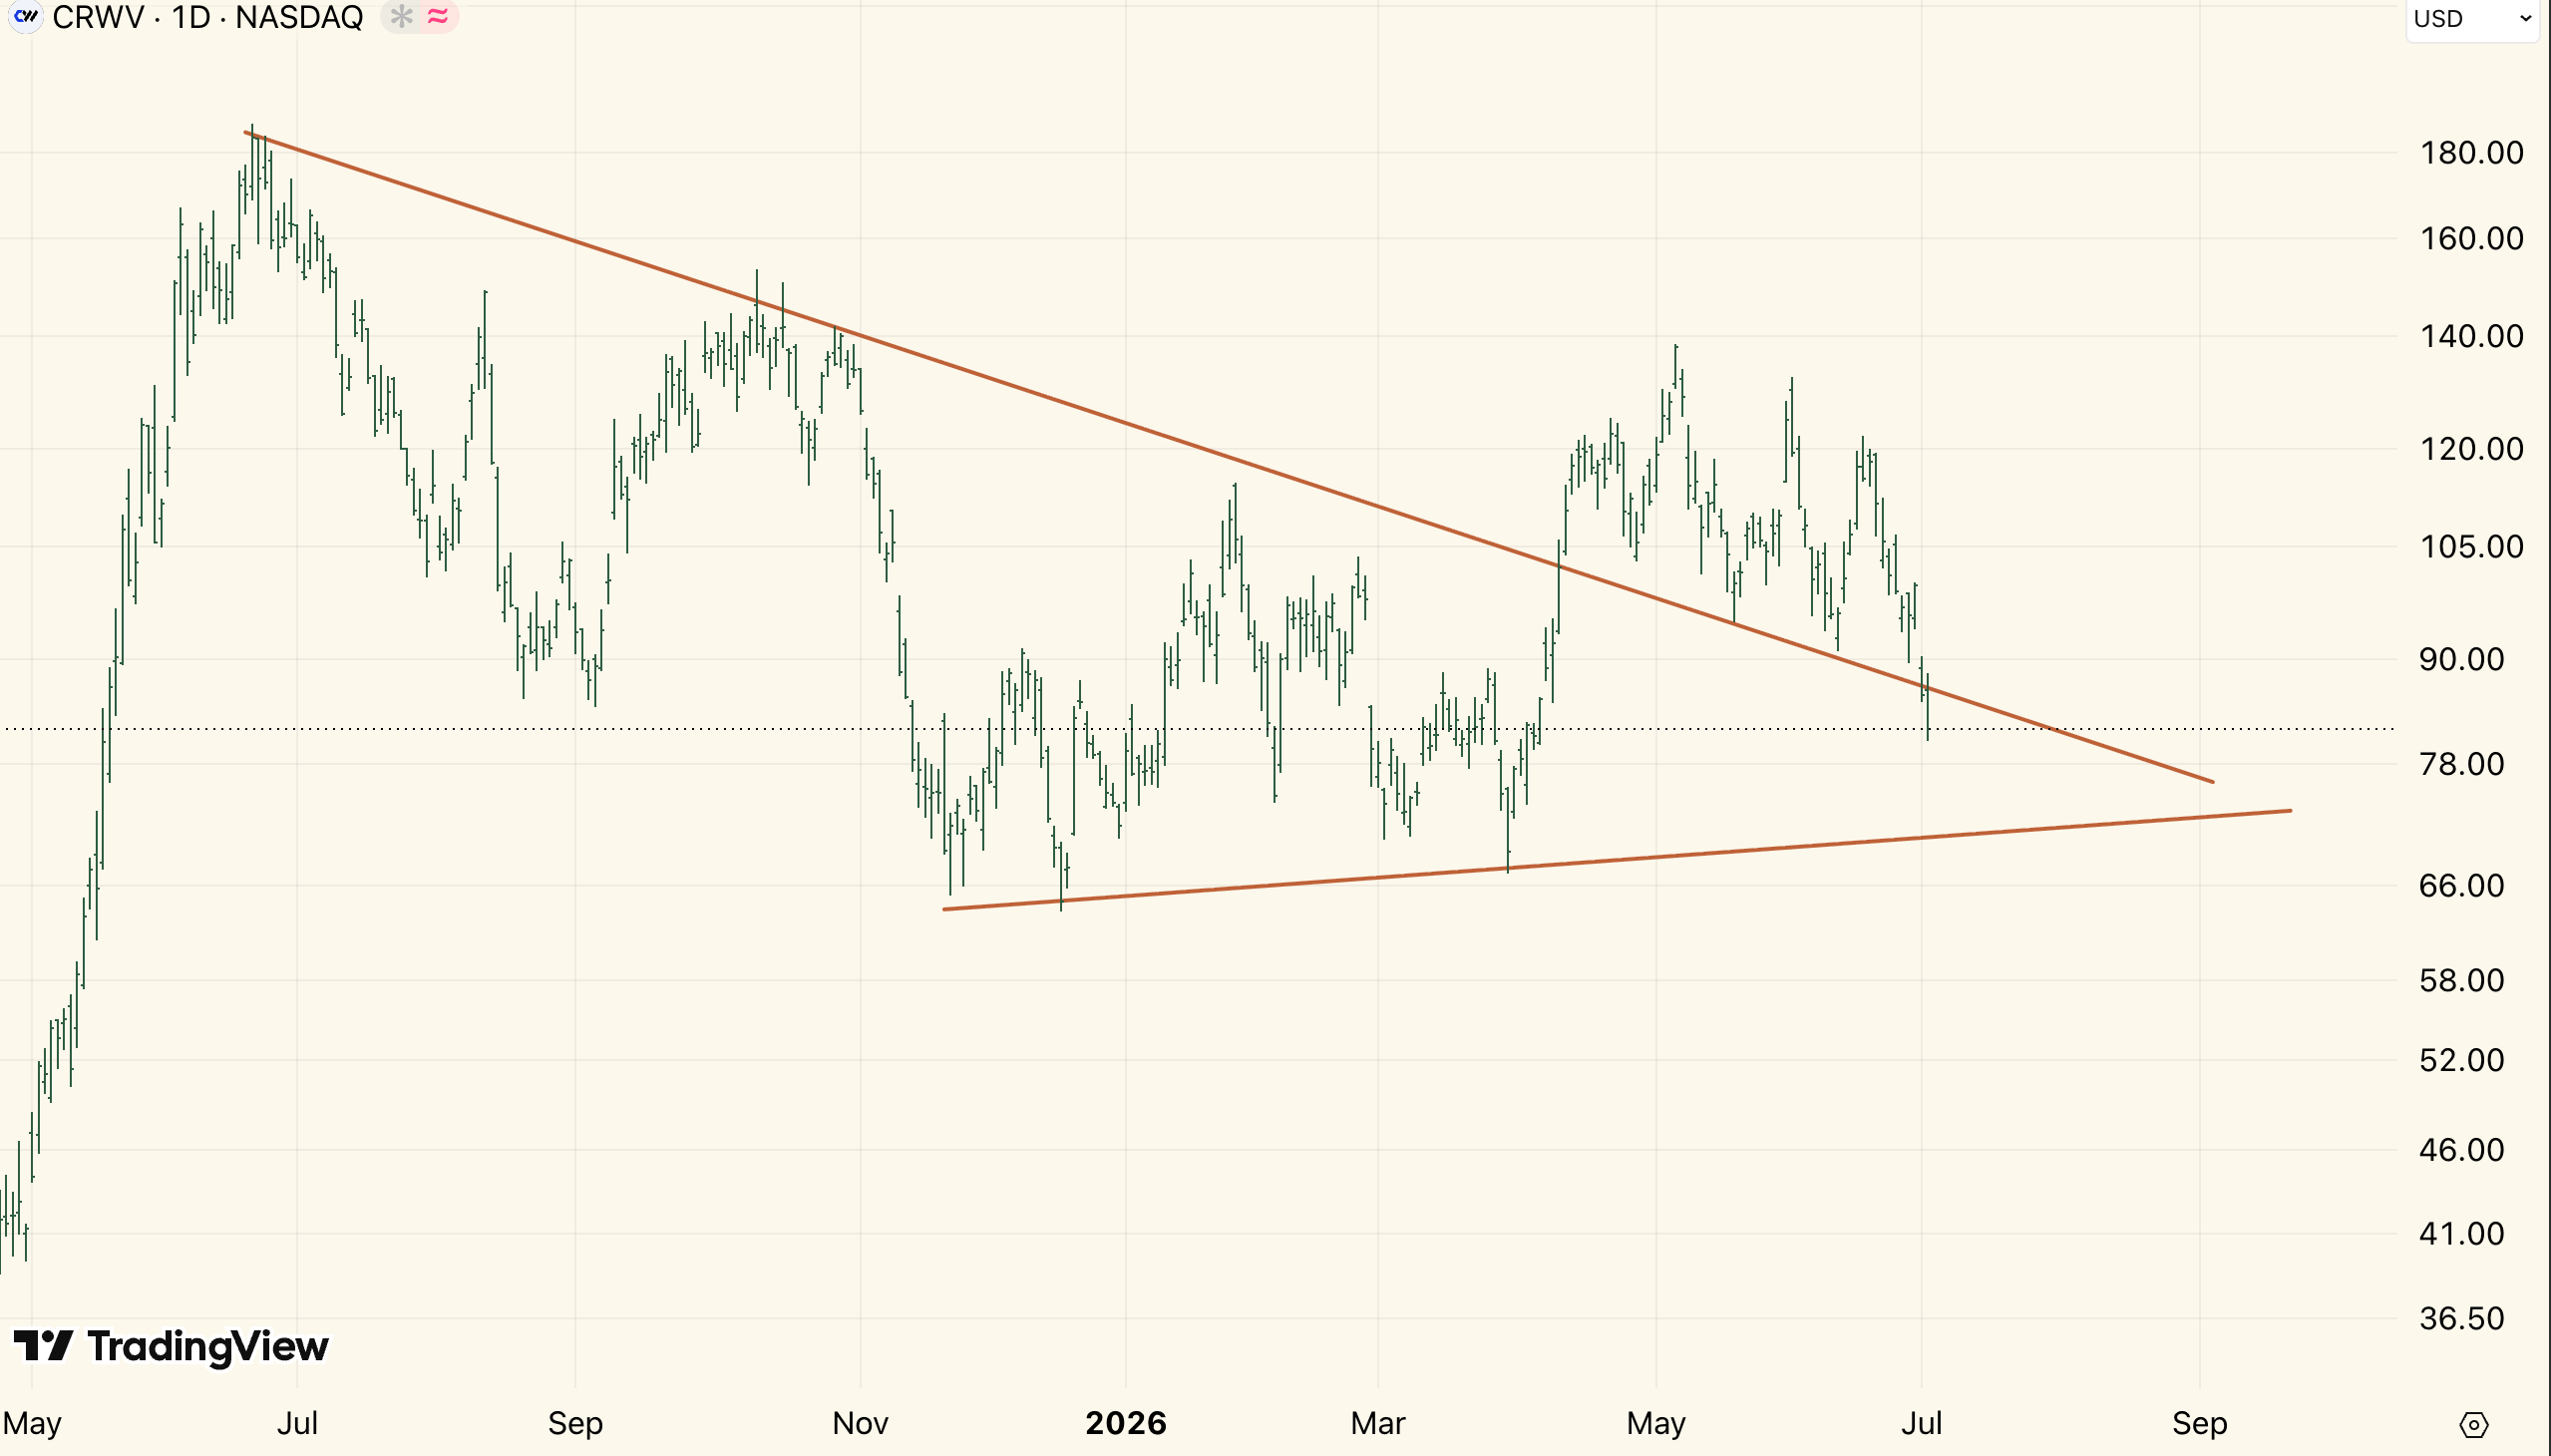
It would be natural for it to head lower, the trend has also shifted bearish in the past two days.
Nvidia ($NVDA) which financed many of these NeoClouds, is sitting on the lower boundary of the massive rising wedge that has been forming since its historical run from $38 in 2024 to $234 in May this year.
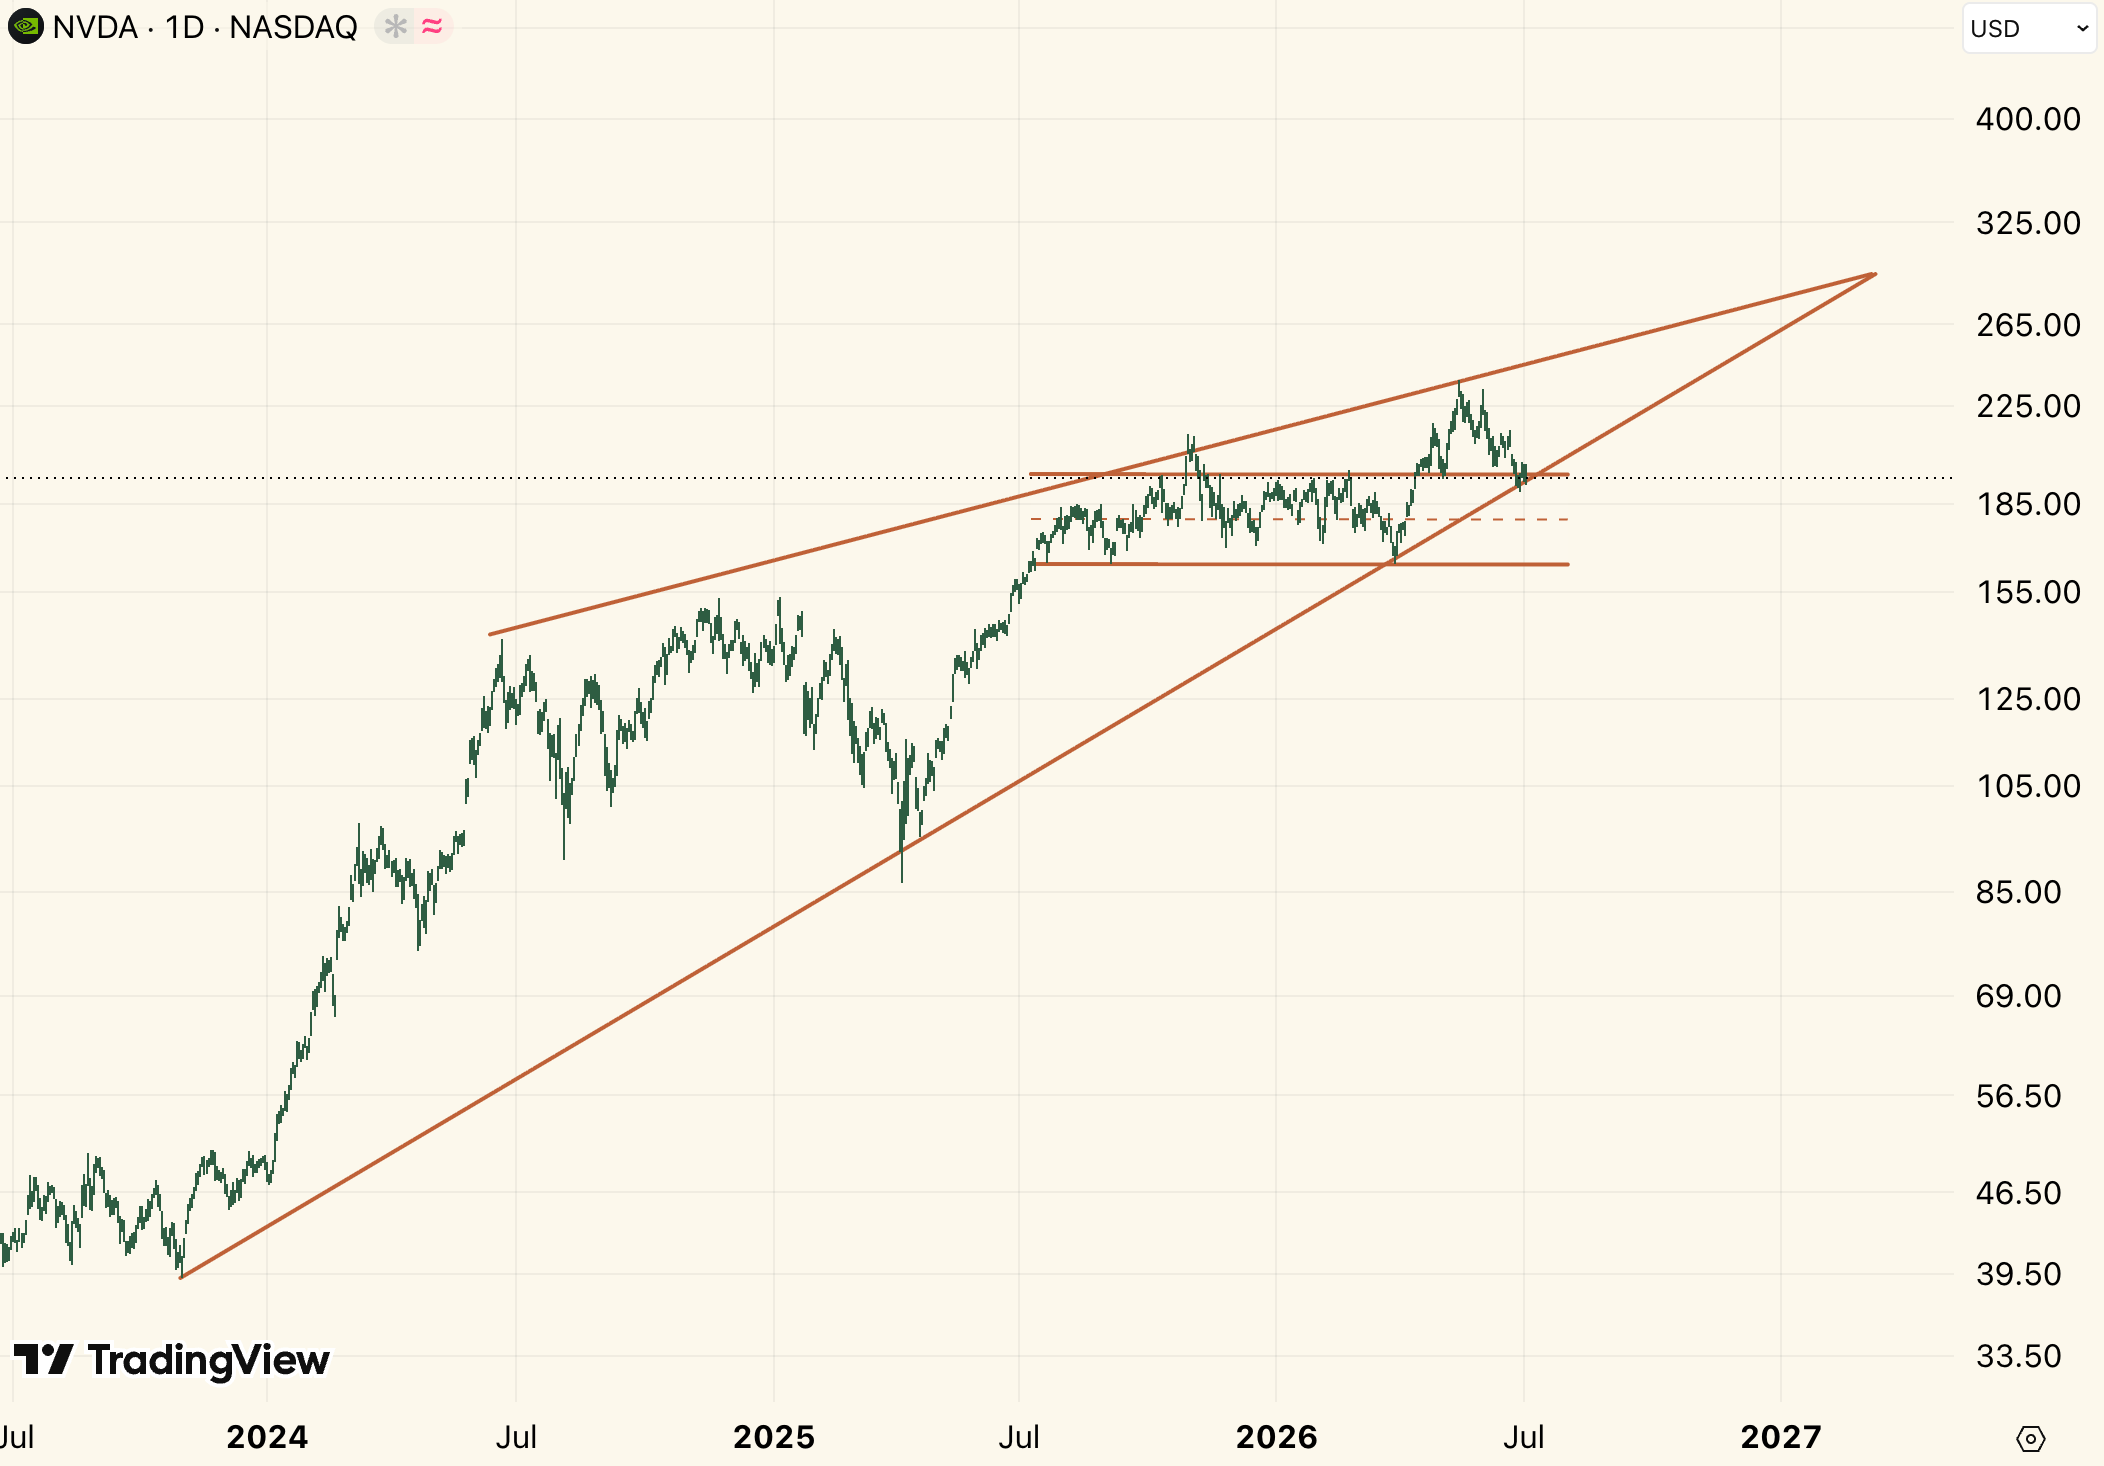
Yogi Berra reminds us that it ain’t over ‘til its over, but this bearish formation has an end date on it: Q1 2027. The chart is telling us a simple story: either NVDA has topped and it will fall below $190 soon and confirm this, or it has another leg up, that could be as high as $250-$275, that will happen within the next 6 to 9 months, and then resolve lower.
Micron ($MU) despite one of the most upbeat earnings calls ever is seeing its chart break down too. The historical run from the $310 level in April to $1250 formed a bearish rising wedge, not unlike the one in NVDA, but on a shorter time frame.
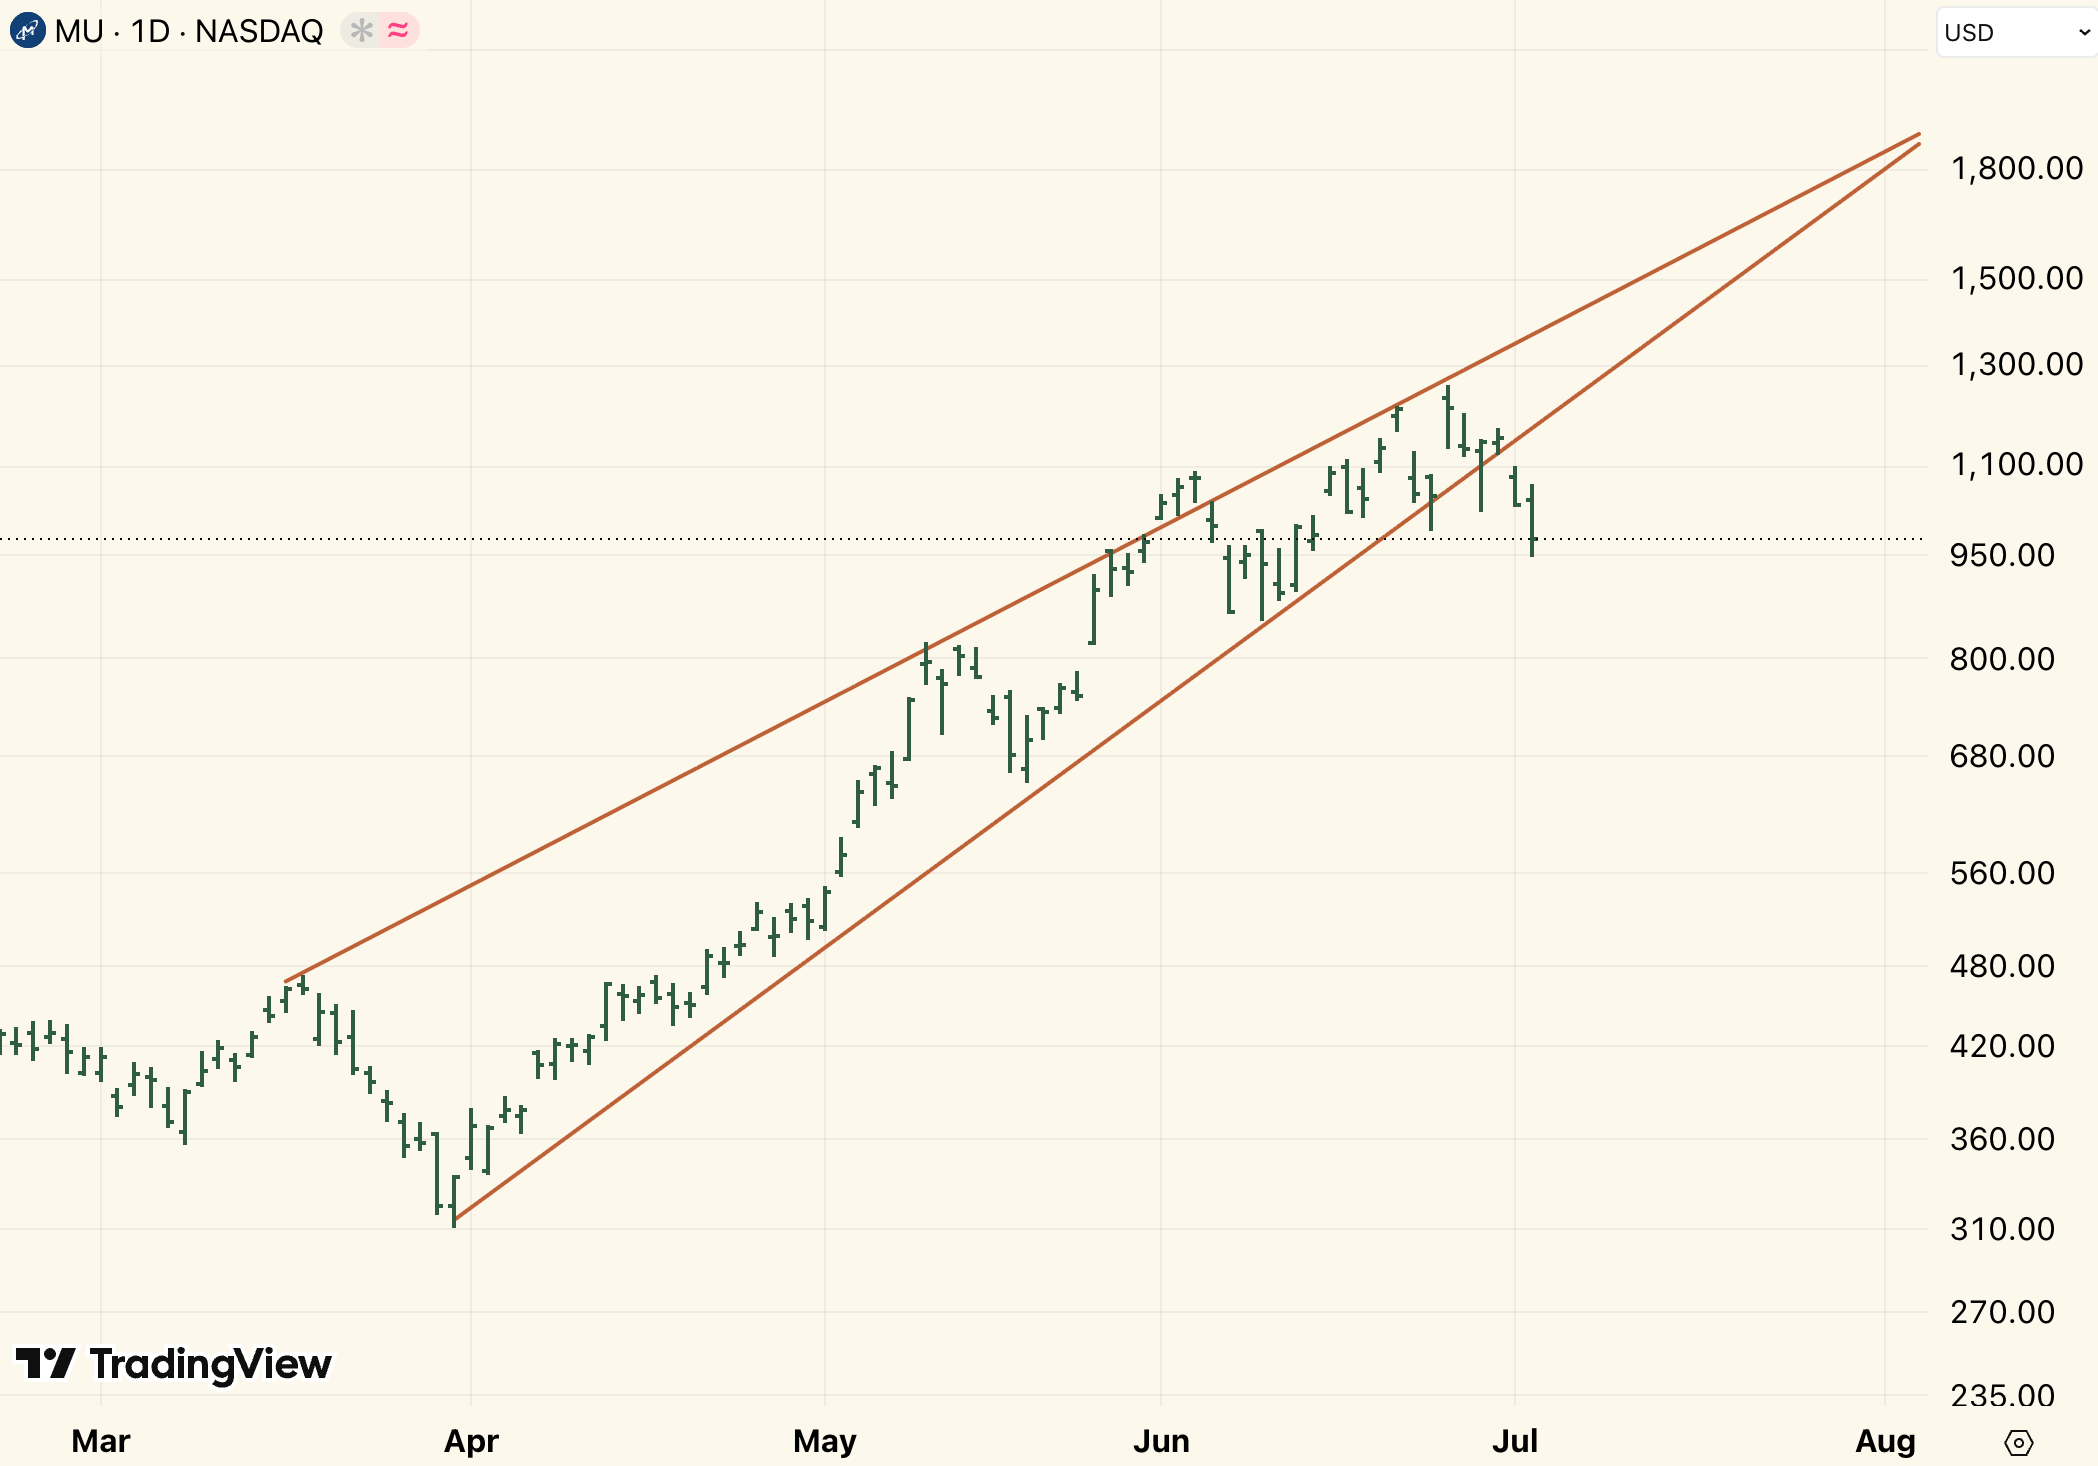
In the past two sessions it has broken down clearly from the support. In June it tried but failed a breakout to the upside, and now everything is reversing.
The KOSPI, the Korean Stock Exchange, of which two chip stocks are more than half of the index, has broken below the ascending channel of the very same move that powered Micron since April this year.
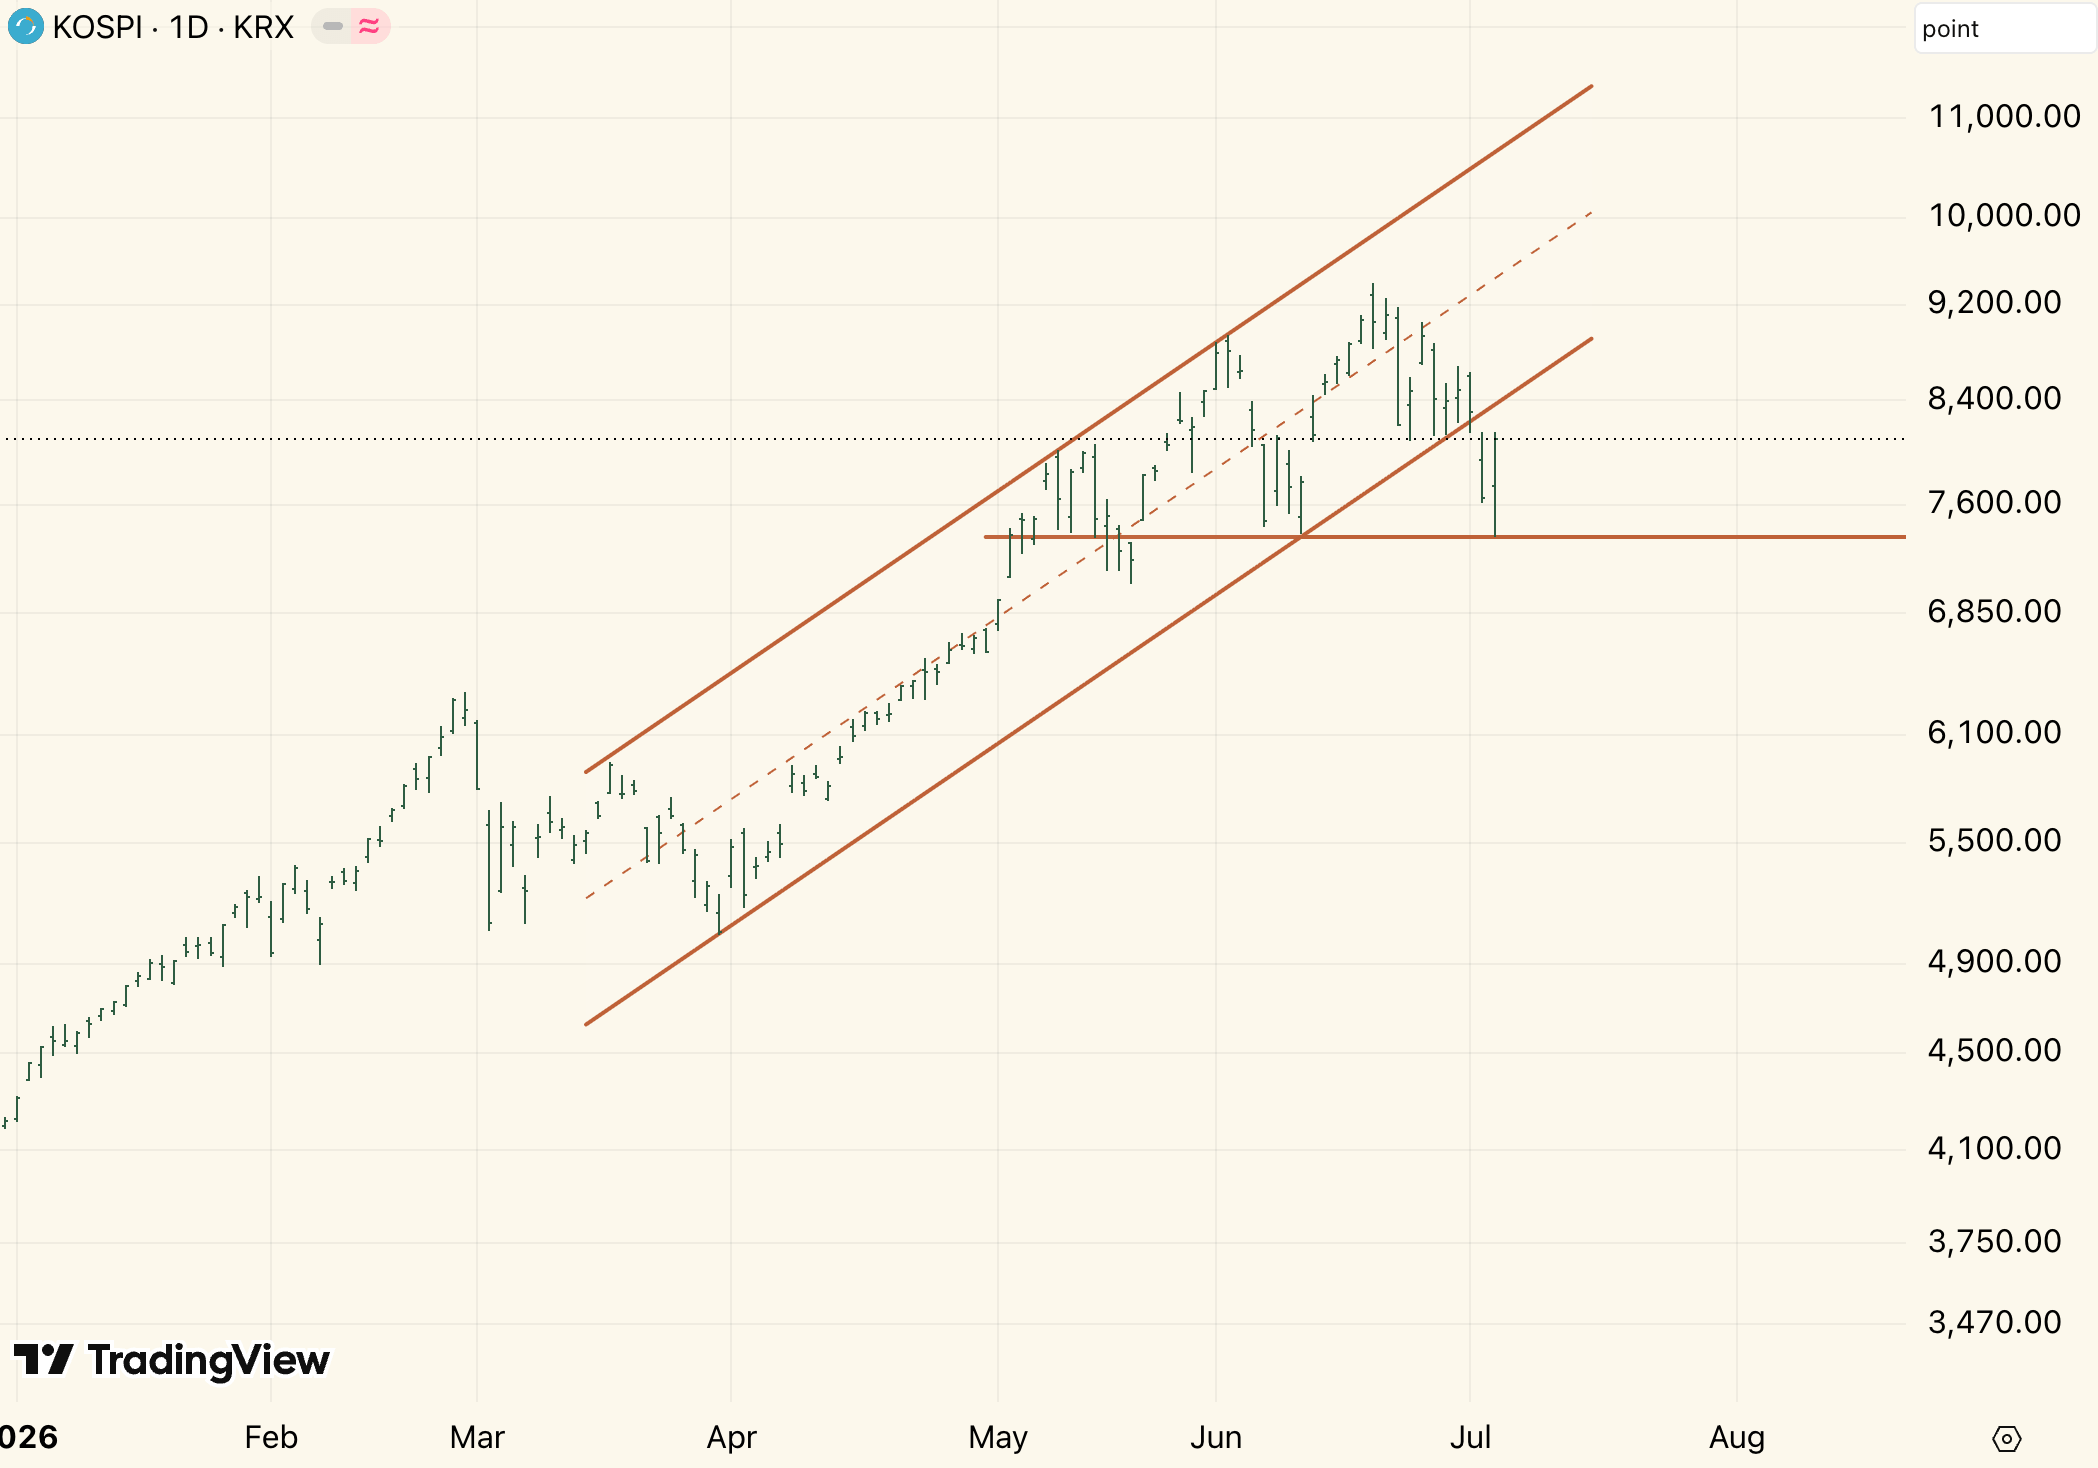
$7,375 is the line in the sand. Below that, this trade unwinds, and along with it, the leverage which Korean retail has taken on to participate in this trade.
Move to the hyperscalers, Microsoft ($MSFT) broke down of the wedge it has been forming since 2022, retested and got rejected.
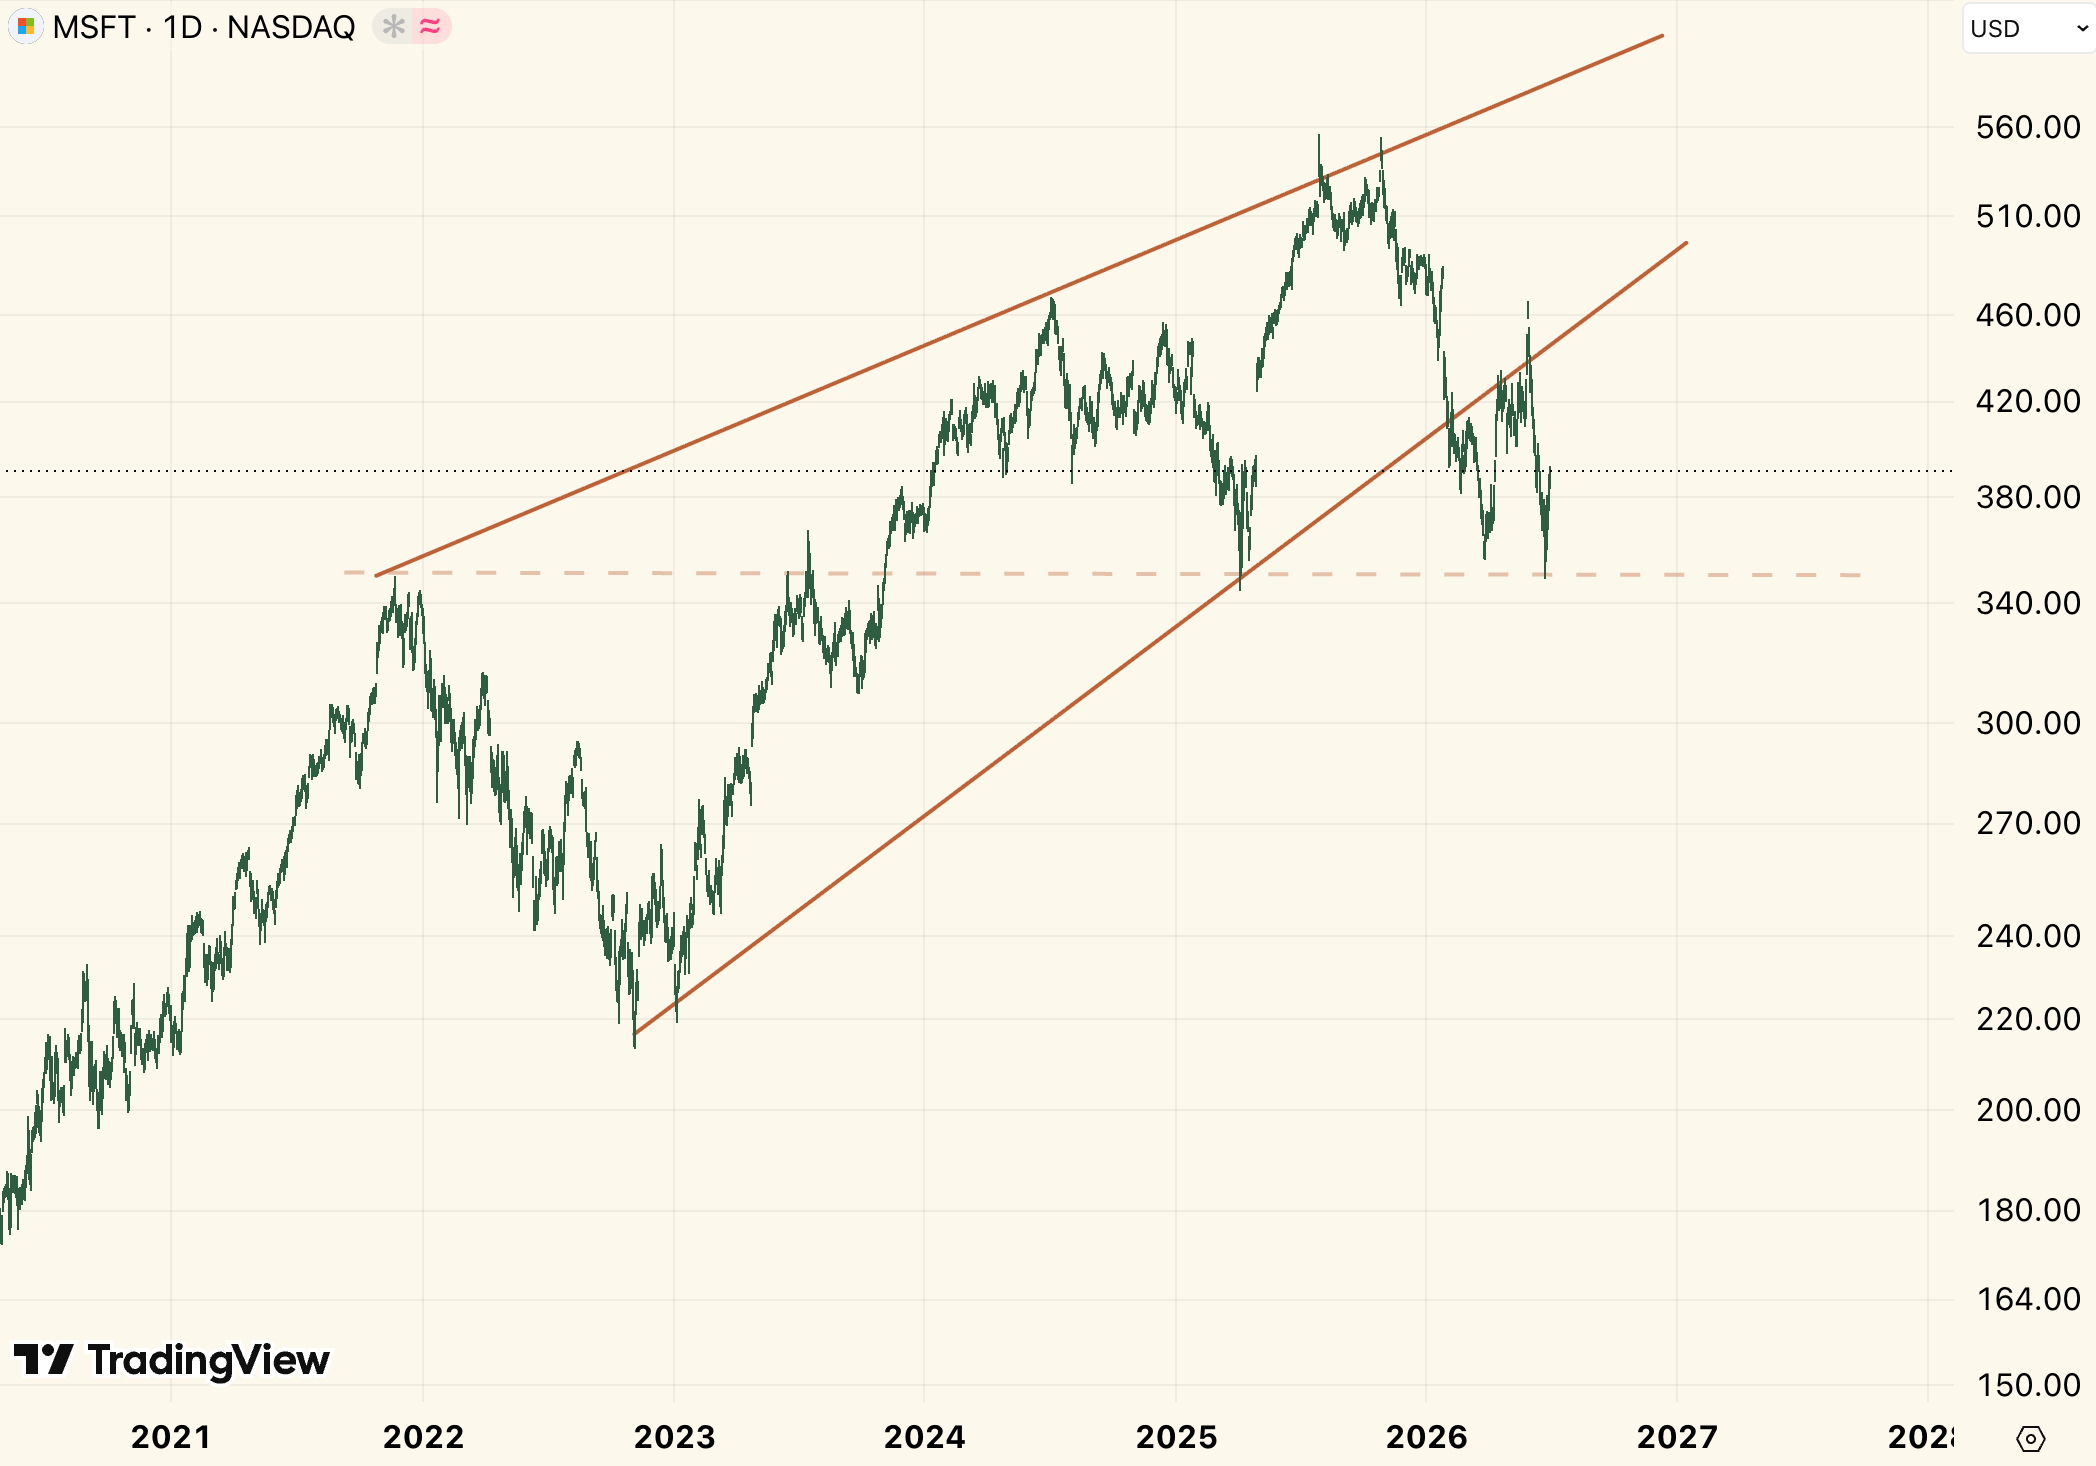
The $350 level marks the line in the sand, below that the stock turns very bearish. At the best it’s looking like sideways consolidation between $350 and $450, the downside is particularly bearish.
Oracle has been forming a consolidation triangle, and currently it sits at the very bottom of it, slightly below.
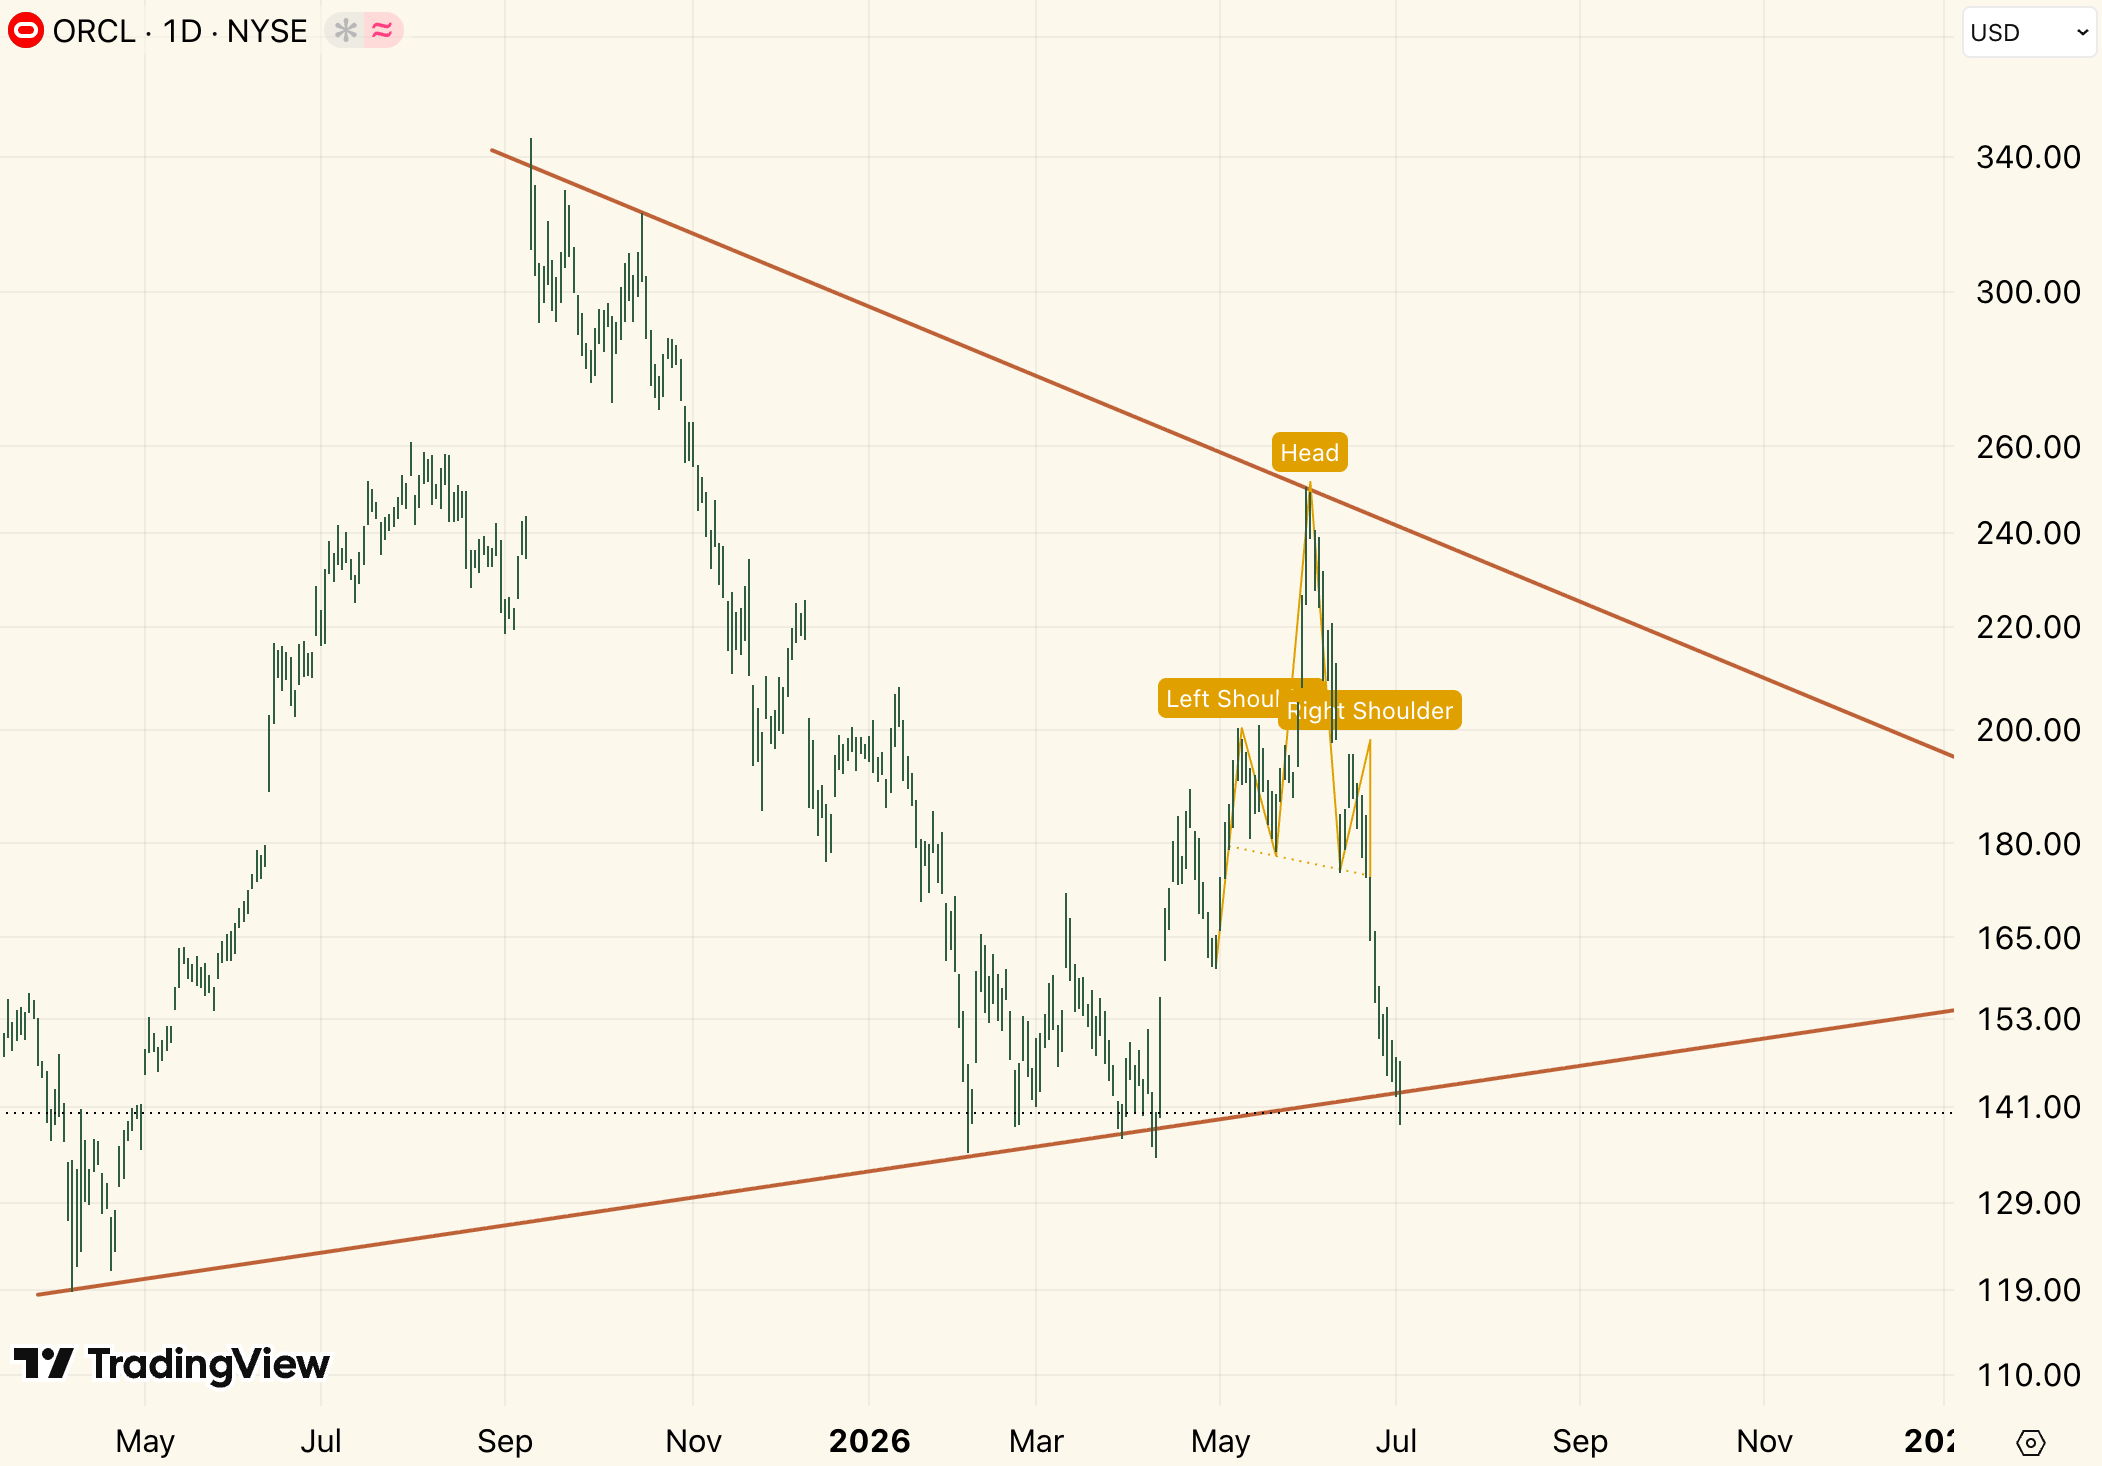
Now technical charts only inform us of possibilities not probabilities, but because there is no trading on Friday, this would mark the first weekly and daily close outside of the formation, suggesting further bearish sentiment from here onwards.
Google ($GOOGL) is more nuanced. The good news is that it seems to have broken out of the epic ascending channel that started in 2009 at an adjusted price of $6 bringing it all the way to $359 today.
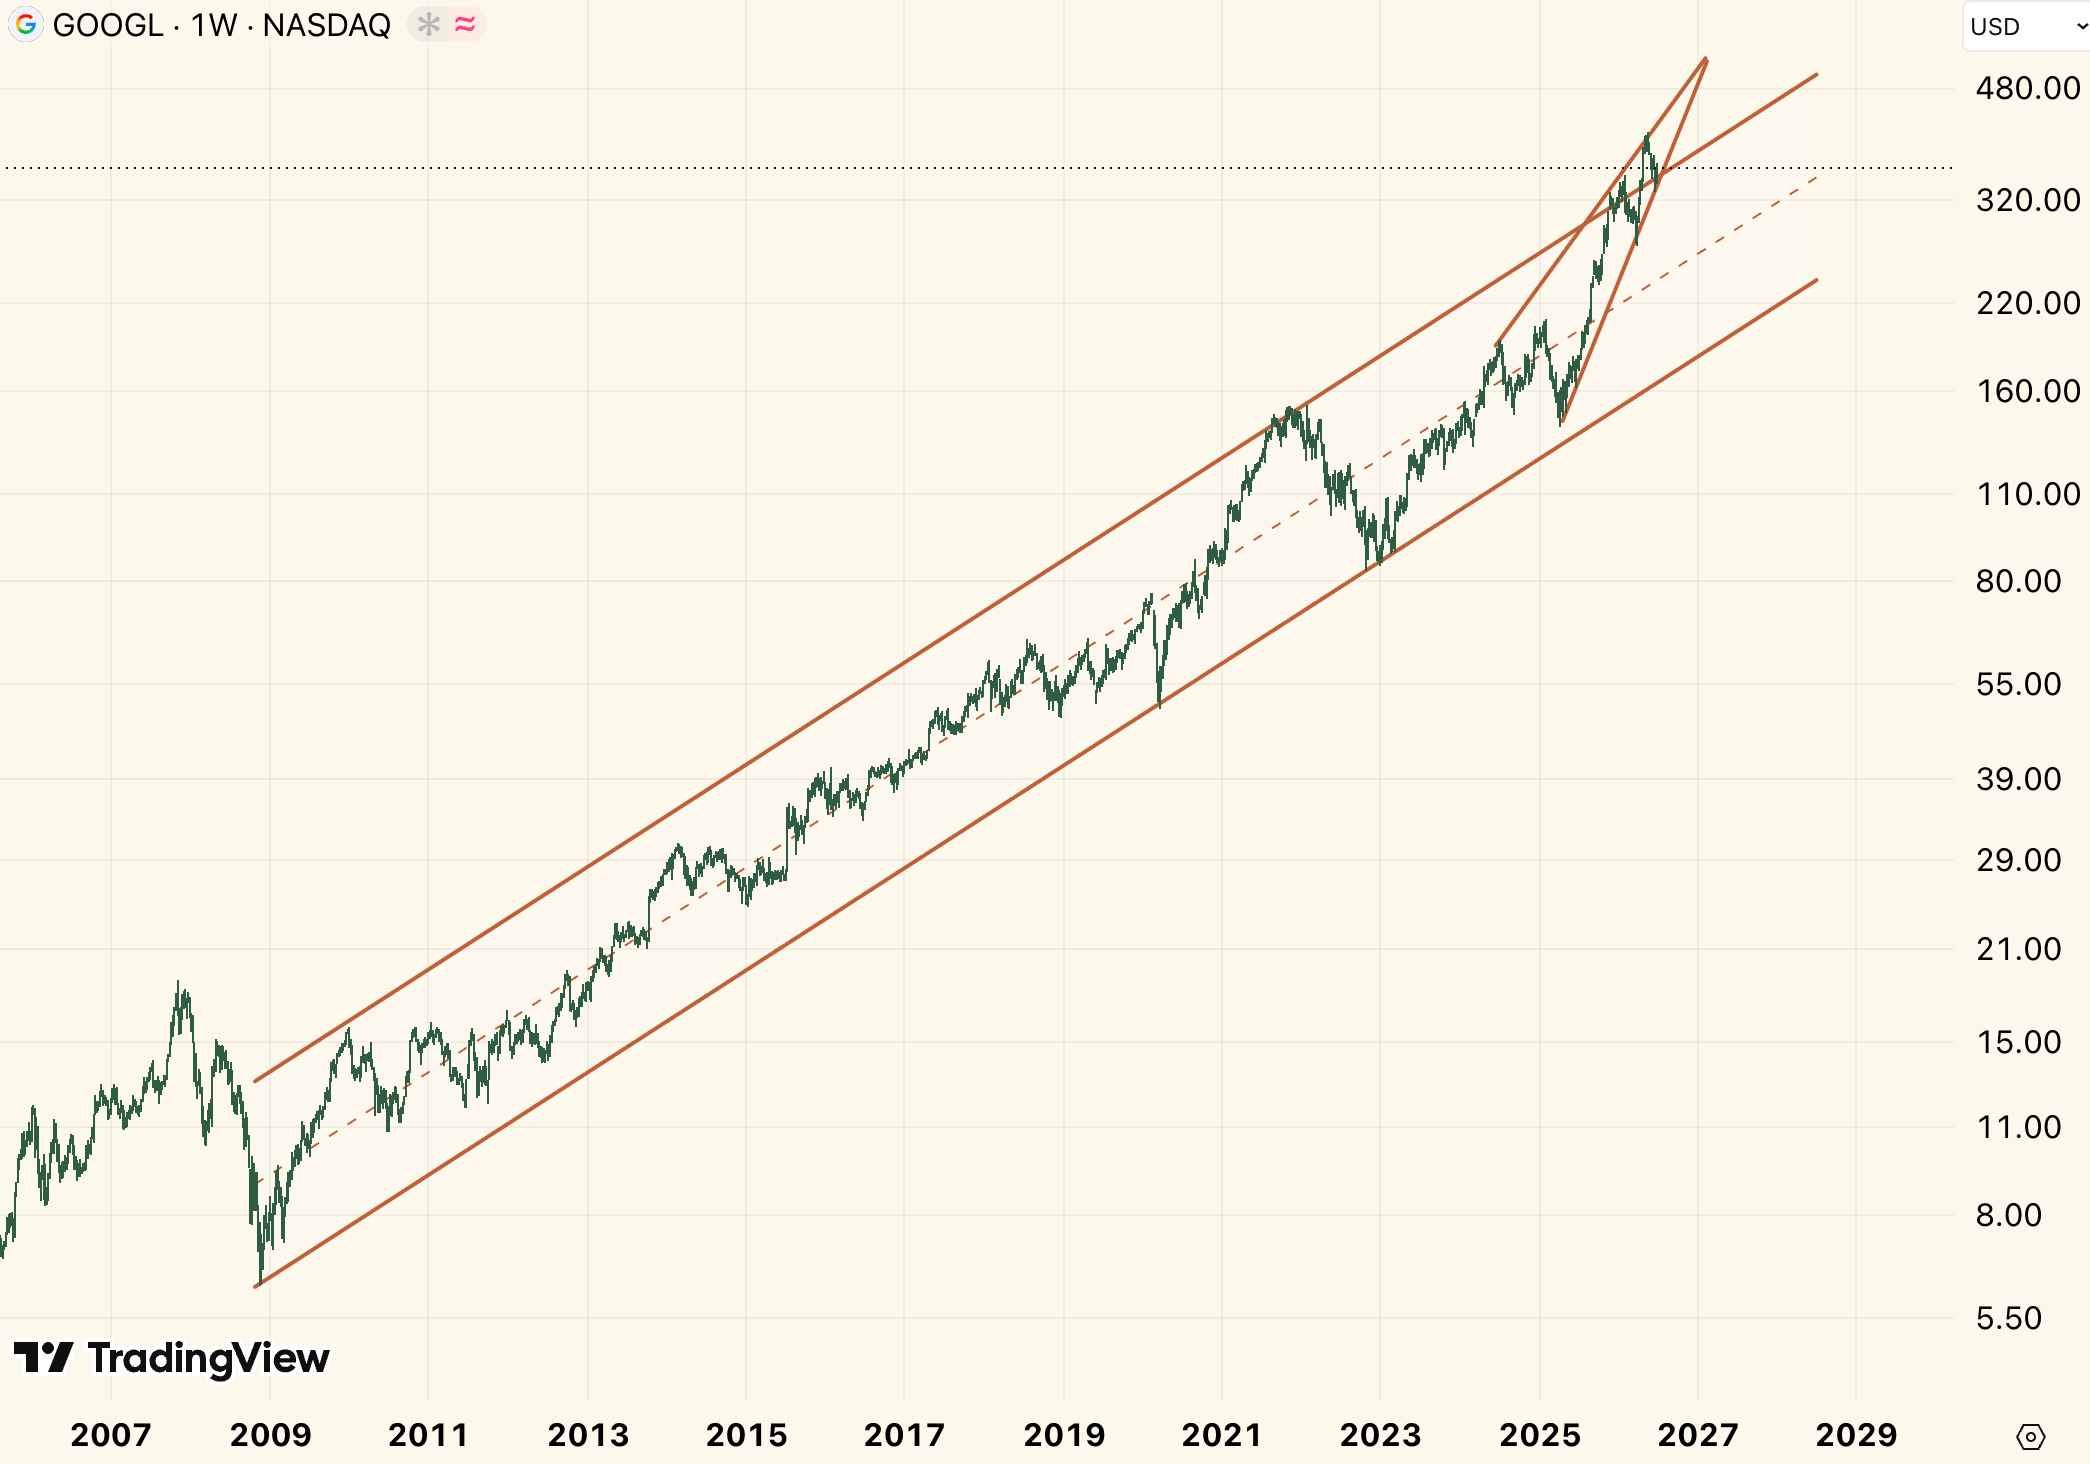
The bad news is that it is staging such a breakout by forming a clear ascending wedge, the same bearish formation which Micron and Microsoft broke down from and which is threatening Nvidia. This means the breakout is likely to be a blow off top which reverses hard.
Unfortunately the bad news does not end there. Amazon ($AMZN) is also approaching the APEX of a rising wedge within the next year.
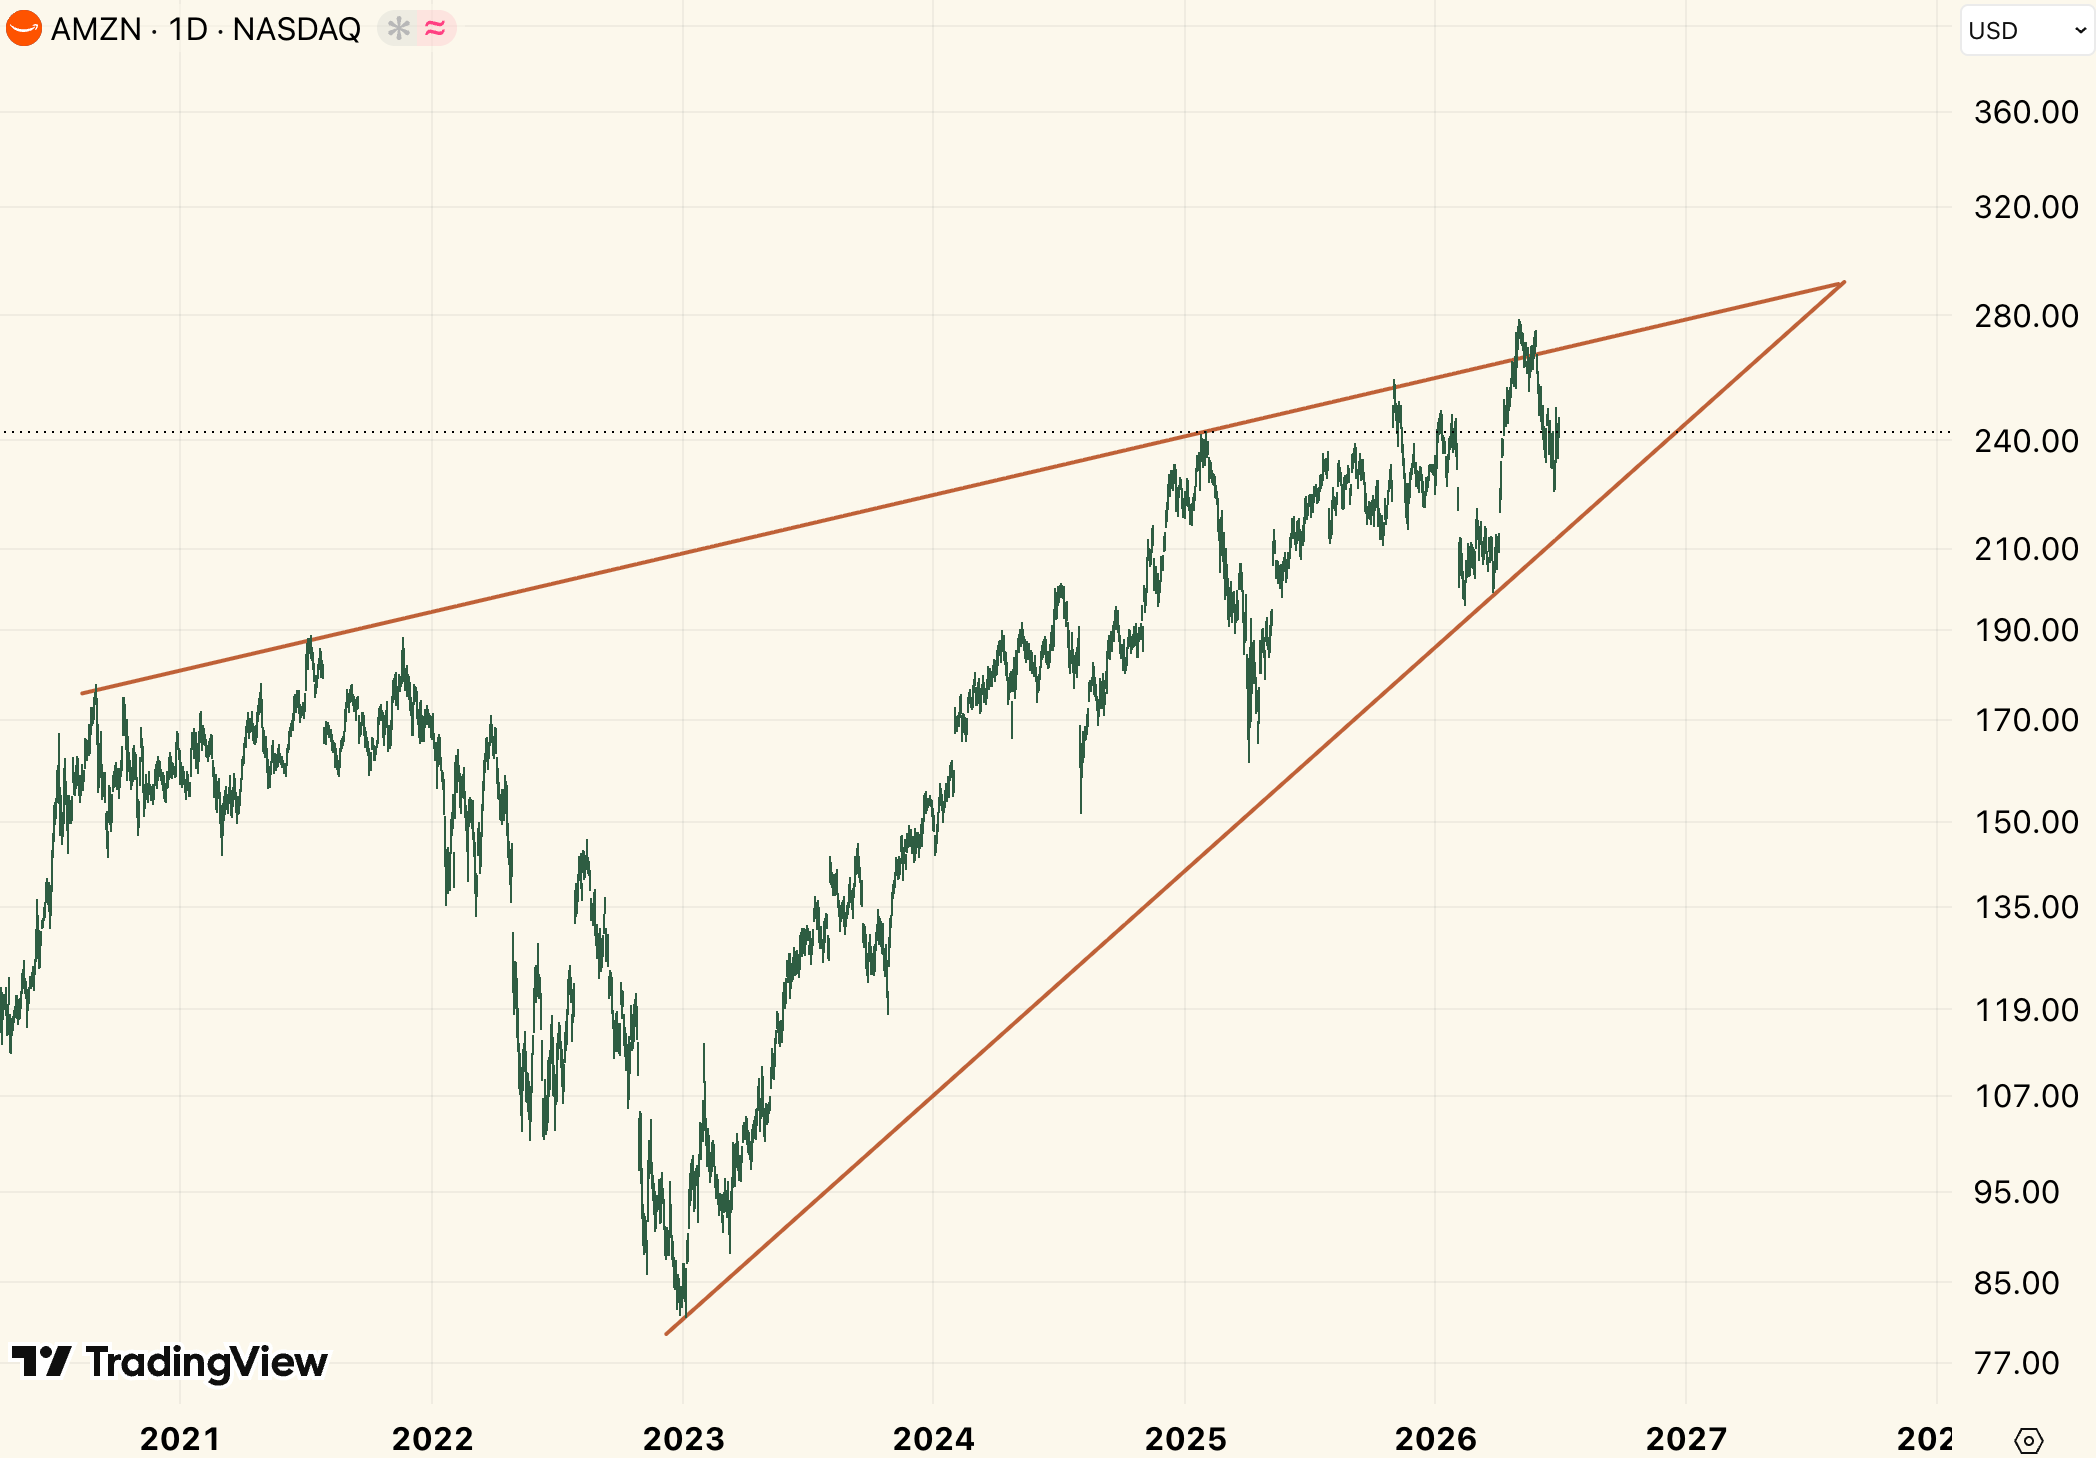
Schabacker said of rising wedges that they represent “a shrinkage of activity in the stock as the feeling grows that it is temporarily over-running its true relation to underlying values.”
I fear, after running through this chart library, that this is exactly what we are seeing with the AI trade.
Nothing good happens after 2 AM.
I grew up watching the TV show How I Met Your Mother. My brother and I would binge watch it on Megaupload (the good ole’ days).

In it there’s an episode where the main character, Ted, tells you there’s nothing good that happens after 2AM. The party might rage on beyond then, but people are more irrational, mistakes happen more easily, and anyway you look at it the risk return just doesn’t look right.
That’s where I feel we are with the AI trade.
It’s past 2AM. No matter how you look at it, the cracks are starting to show. It makes sense that the bigger the new technology, the more it gets overbuilt.
This is the time to harvest gains. It most certainly isn’t time to deploy more capital into the trade. If you still have positions (as I do in Broadcom) that are at huge gains, it is fair to let them ride out until the tides have clearly turned.
I mapped out the key levels for most of the complex, and it should be clear this isn’t a “sell everything AI” call.
But a lot of the dominoes are starting to fall. I wouldn’t touch memory or neoclouds here, and would be very cautious about the rest of the value chain, and read the tealeaves carefully when choosing to scale out of positions.
What comes next
If you liked this article then make sure you subscribe as for the next 6 weeks I’ll be publishing reports absolutely free.
Then on August 15th I will launch the paid version of Babylon Burns, which will include my global macro views, stock picks, and price targets in this coming regime. If you haven’t read the two previous pieces, I suggest you take a look at them at the following links:
Also I’m still deciding on the exact pricing of the newsletter. In the meantime I have left lowball pledges in place which I will honor for anyone who pledges before the newsletter goes live.
I’m not quite sure what price will be at launch, but there is no way you’re getting a better price than this.
As Babylon burns, we’ll light the cigars.