I recently got this question by a member of Babylon Burns, and as I was typing out my answer in the comment section, I realized that the answer was getting long enough to warrant a full post.
Furthermore, I could use some graphics to support the case 'I’m making.
This was the question:

And here is my answer:
Great question, but I have to push back on both of these frames.
The first is that I am “so reliant” on technical analysis.
I think it is quite clear from the depth of the reports which are written that I am looking for situations with superior fundamentals, clear catalysts AND, yes a good chart.
The Jeet Kune Do of Investing
Use only that which works, and take it from any place you can find it.
- Bruce Lee

I think one of the greatest limitations of investors, is they get married to a style. For a long time, that was also true in Martial Arts. Bruce Lee’s Jeet Kune Do, which was a philosophy more than a martial art, was to take from each style what works, and discard what doesn’t.
In modern day mixed martial arts, it is now expected that fighters will be proficient in striking, groundwork and wrestling. Before the UFC, that wasn’t the case.
Interestingly enough, taking what works, was also Soros’ approach to investing.
My peculiarity is that I don't have a particular style of investing or, more exactly, I try to change my style to fit the conditions.
- George Soros
I came into the investing world through the school of Graham and Dodd.
My parents were thrifty consumers, and the idea that you could buy $1 for $0.60 always appealed to me.
A repository of Warren Buffett’s investor letters made for my fundamental education in stock market investing.
There are a few things I’m obsessed with in life, but none that have quite captured my soul as much as investing.
Over time, I’ve studied, traded, implemented investing strategies which were inspired by Peter Lynch’s or O’Neill’s GARP approach, Mandelbrot’s work on the fractality of stock markets, Jim Roger’s macro trading insights, event driven investment, and classical technical analysis.
Along the way there is quite a bit that I’ve learned and tried that I have also discarded.
The fact that we can point to successful investors in most of these styles suggests that there is something true about each of them.
The complete investor doesn’t limit himself to one way. His only limitation is no limitation.
Using no way as a way, having no limitation as limitation.
-Bruce Lee
So why technicals?
That fundamental basis is in actual stock market trading, and actual stock market trading is the result of individual actions by many thousands of people, based in turn upon their own hopes, fears, anticipations, knowledge or lack of knowledge, necessities and plans. It is the danger of losing sight of this human element in stock charts that we must guard against, and since this human element is basic it may be wise to fit it into the foundations of our study at the very outset
-Richard Schabacker
Some people think technicals are just la-la-land lines, but they are a ledger of all past transactions.
They tell us where market participants have bought, where they have sold, and in what quantity.
And looking at these things gives us a very good understanding of market structure.
And to be clear, I’m not looking at the hourly or minute charts, I’m looking at 1 day or 1 week candles, which reveal buyer and seller behavior over months to years.
And no they are not a crystal ball, they are not a prediction of what will happen, they are a description of what might happen. They give us insight into seller exhaustion, buyer excitement, the balance of power between the bid and the sell.
So as investors we kind of have two options: do all the fundamental and catalyst work and ignore the technicals, or incorporate the technicals to have an extra last mile view.
Timing matters. A double over 1 year is a 100% return, but over 7 years it’s only a 10% annual return.
And using technicals takes a certain level of humility.
It is like saying: I have this idea, I believe there are catalysts which can unlock value, but I respect that my knowledge and information is partial and likely biased.
So you look to the left and to the right, to see what others are doing. Ignore what they are saying, look at what they are doing with their money: that shows up in the order book, in volumes, and in the candlebars on a chart.
Before any individual stock is bought or sold, the trader will assume that his hopes, his expectations, his plans, his technical analysis, may all turn out to be just about 100% wrong.
-Richard Schabacker
The way I see it is you can invest in a great narrative and a great valuation with a shitty chart, or you can invest in all those things and in a great chart.
To me it’s a no brainer.
Now, let’s look at a couple real world examples since I launched Babylon Burns.
Leonardo (DRS): stopped out of the position
DRS supplies the electronics inside other platforms, naval electric power and propulsion, sensors, mission systems, so it gets paid on hulls and airframes it never has to build. Naval electric propulsion is bolted to a submarine and surface-combatant program Washington can't stop funding. Margins are inflecting and demand should be strong for years to come.
That’s a great narrative, a great story, a great business, and it’s difficult to fault it.
When we initiated the position the stock was forming a classical symmetrical triangle.
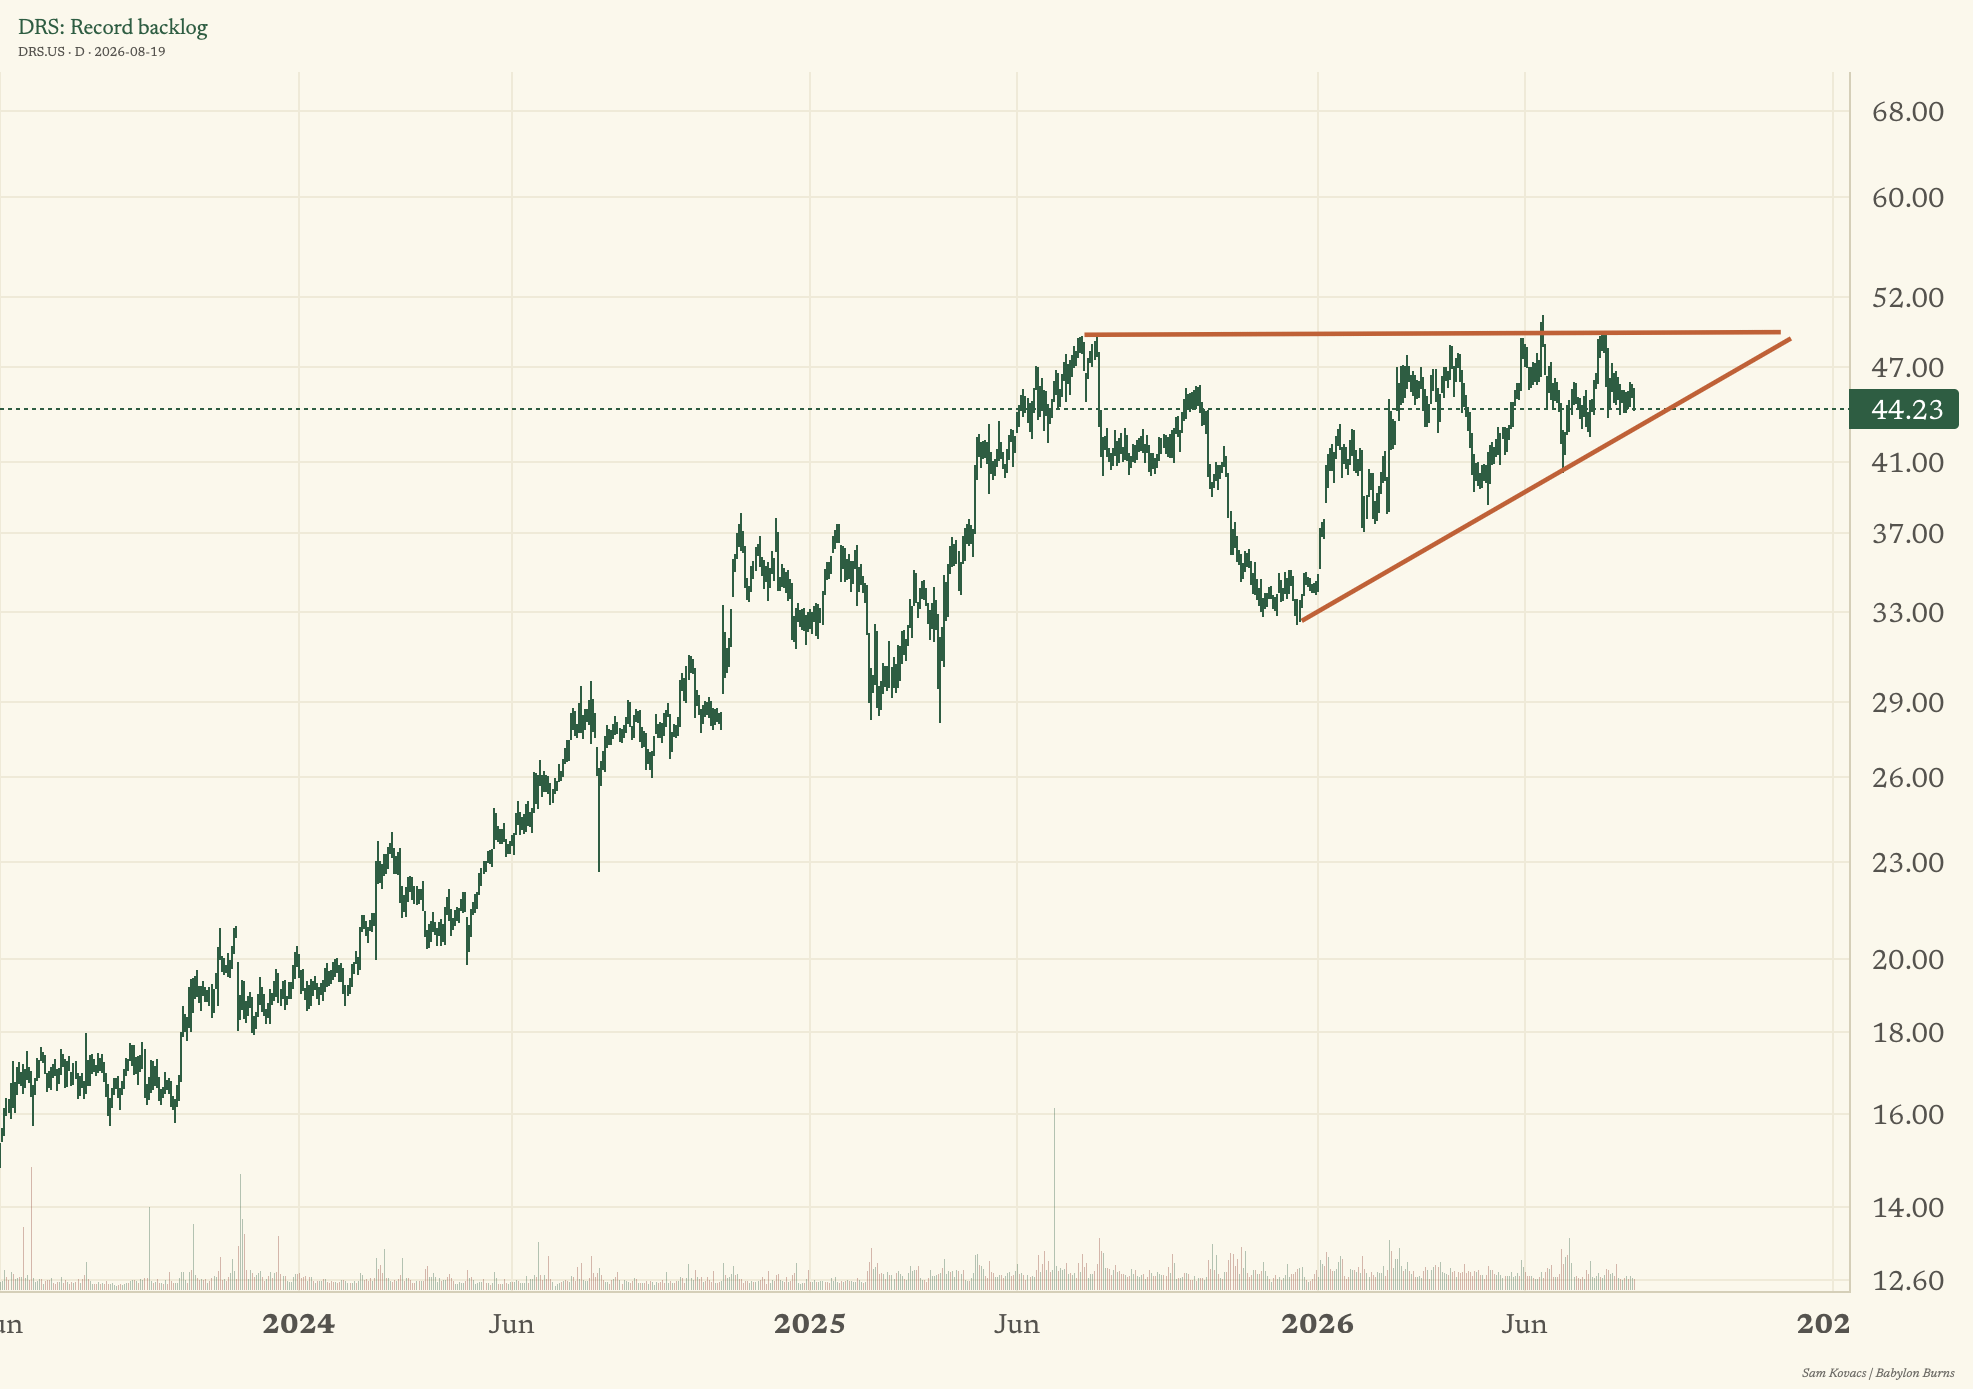
Pure technicians will tell you to not trade formations and only breakouts, but here we were approaching the apex of this formation, which suggested that buyers were coming back to the market at successively higher levels while supply remained resting at the same level.
The stock broke out of the formation alright, but to the downside.
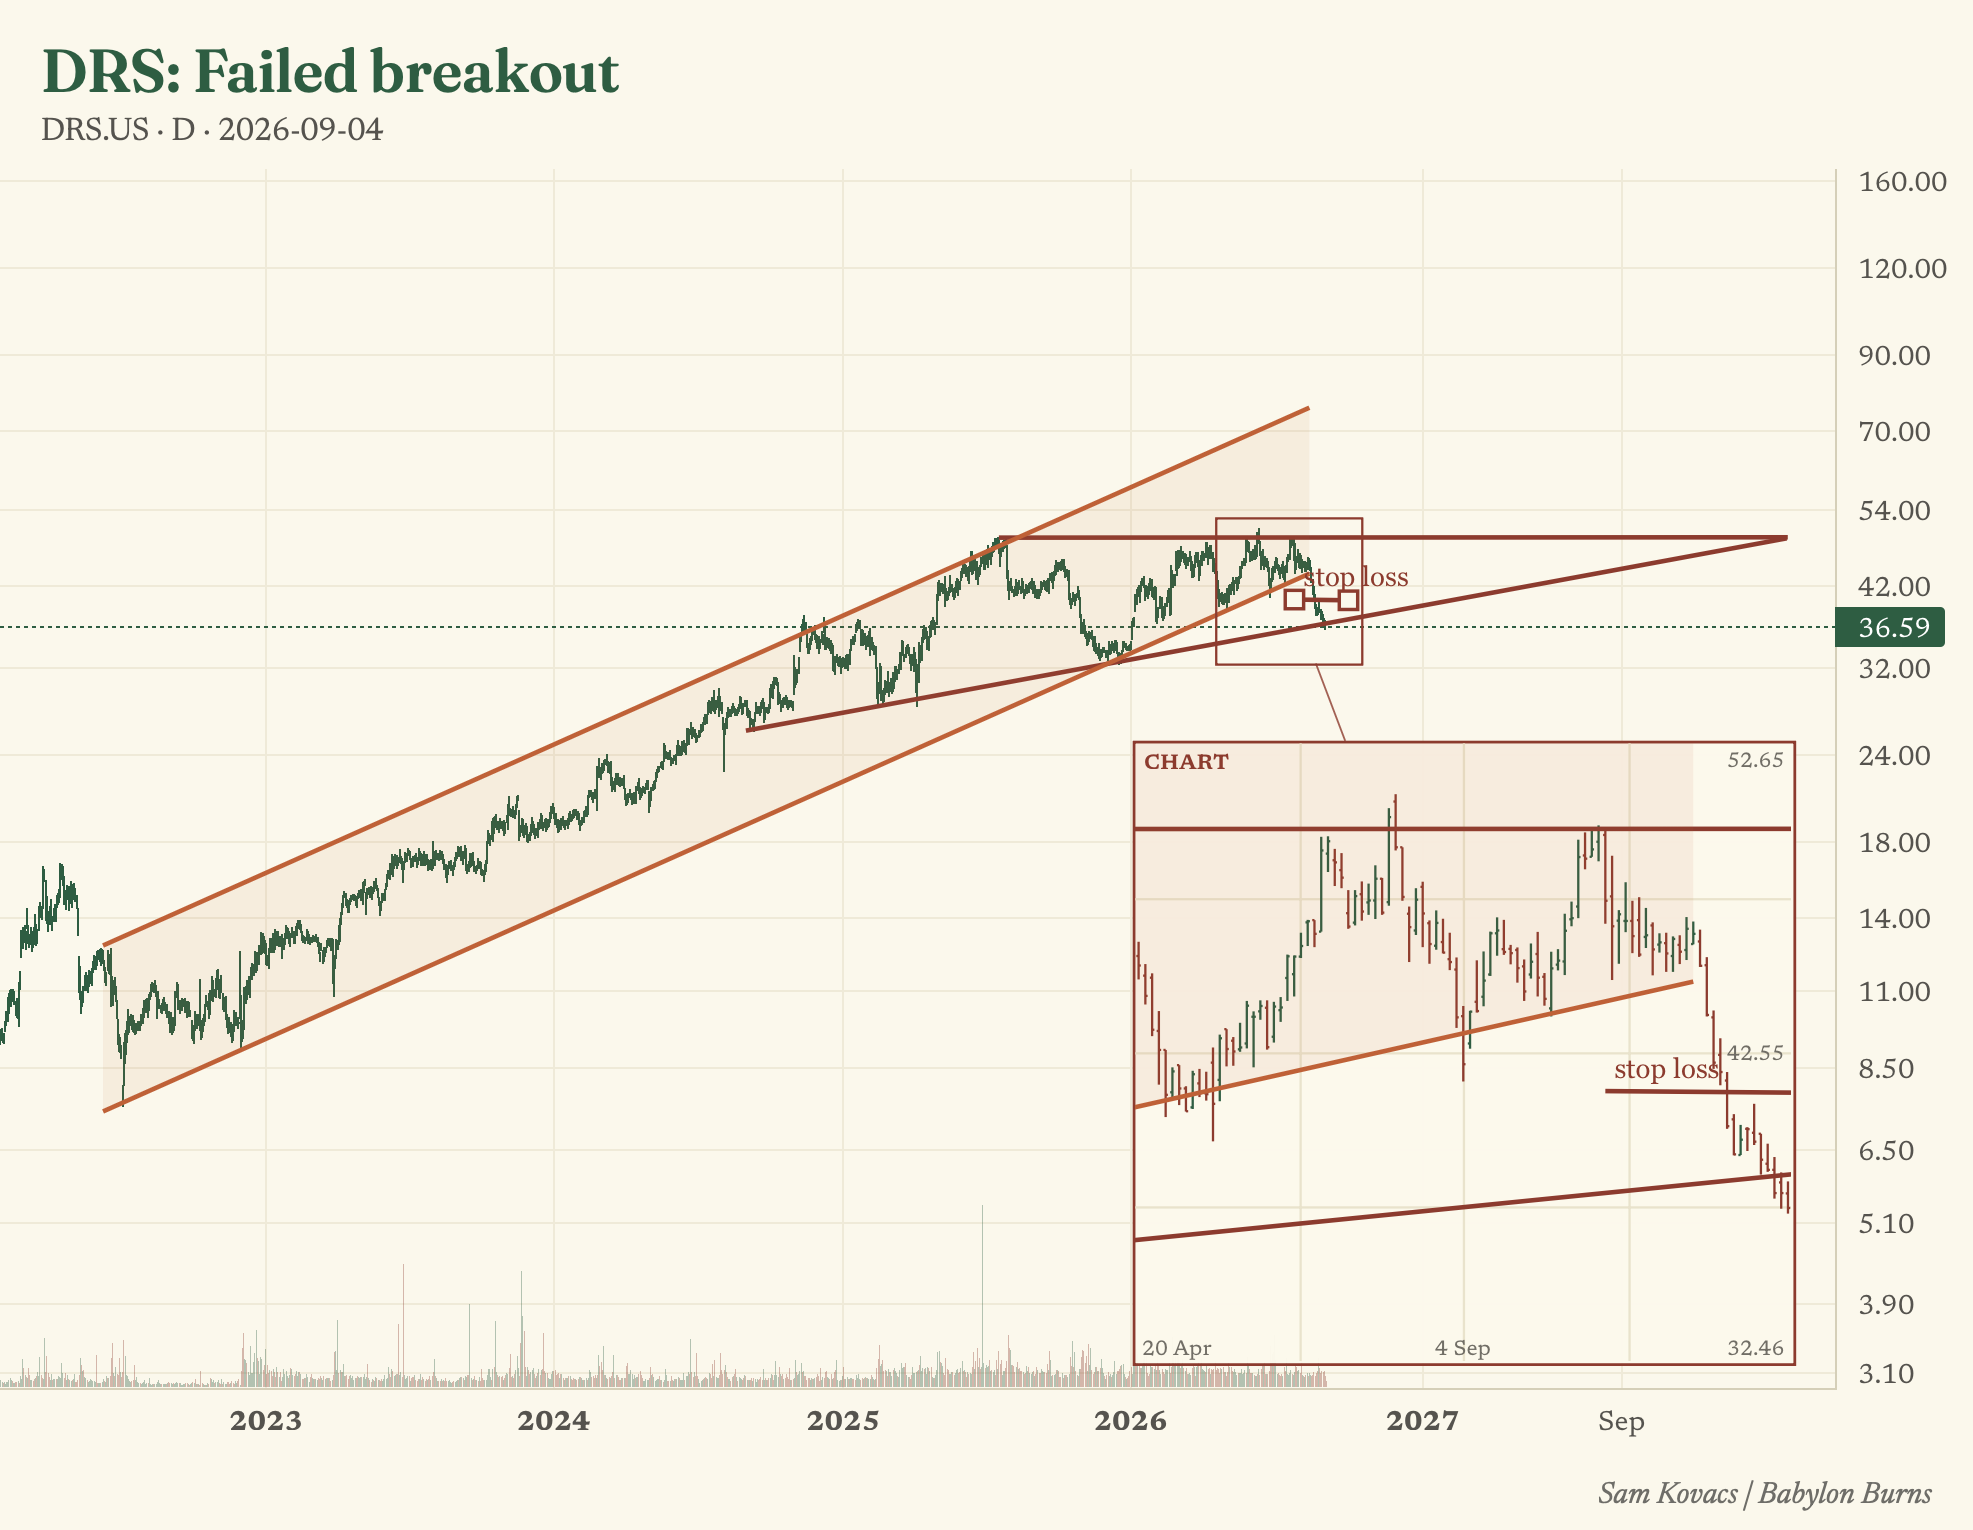
Given that we had predicted this as a possible outcome that would nullify our thesis, we put in a stop loss at $42, and got stopped out. Given the chart was giving us just limited conviction, we had only sized at 1%.
A 5% loss on a 1% position is an 0.05% hit to the portfolio, which as we can agree is nothing.
“It’s not how often you’re right or wrong, it’s how much you make when you’re right, and how much you lose when you’re wrong".
The stock has gone down to $36. Without technicals you’d be reassuring yourself that nothing fundamental has changed, that maybe you should double down, that either way you should hold.
Technicals give us the answer: If this is a good idea, let’s revisit it later.
Love to lose, take a small loss and move on. To have a great idea have many, and you miss all the shots you don’t take.
AVAH: Textbook breakout
Another stock which I covered here (you can read the article by clicking this link),
is a good example of when the trade goes our way.
We initiated it at $9.09, and I added to the position on the way up.
The stock broke out of the triangle, then retested (the resistance becoming support), before a big leg up.
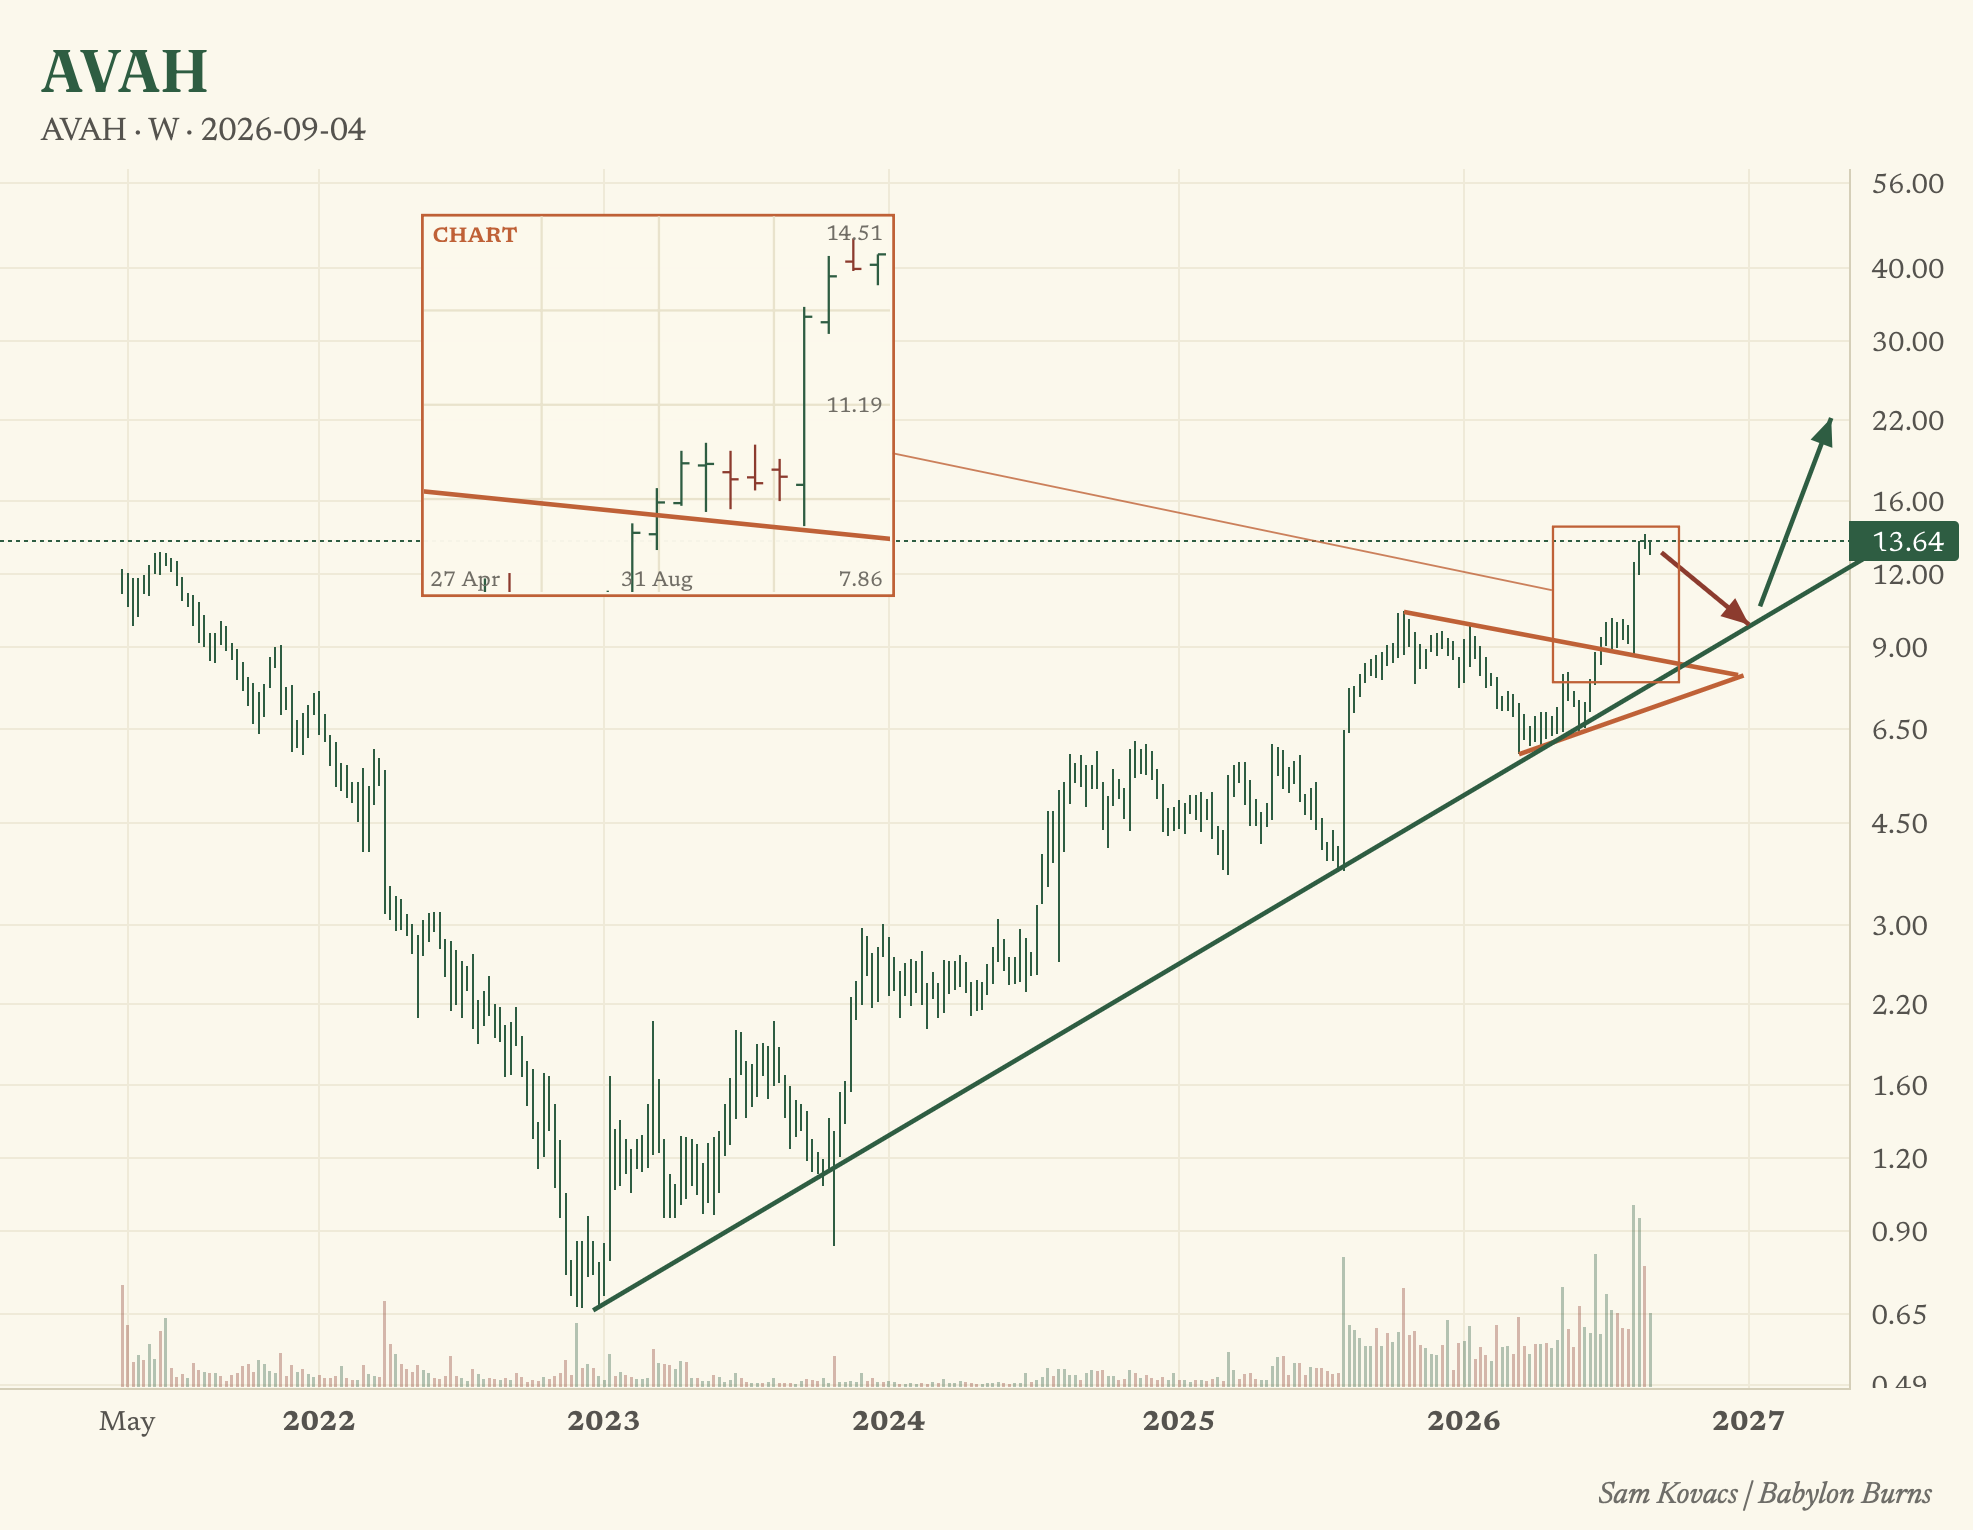
The stock is up 50% since then: Great, amazing, self pat on the back.
There are two lessons:
a. first all the catalysts I had identified in AVAH were supported by its price action, making it easier to get involved.
b. second, we know what we might expect from here.
A quick look at the structure now shows that we could maybe see a retest around the $10 level.
Everytime AVAH has run beyond it’s trend line, it has slowly consolidated before moving up. So if AVAH came to retest the long term trend line and stayed above it, then I’d just view it as an extra opportunity to add rather than panic that my gains are being given up.
Wrapping it up:
Technical analysis is a tool, and it should be included in the analysis. It doesn’t replace or remove the other concepts: valuation, quality, fundamentals, macro rotation, sector rotation, currency impacts, binary events. All of those are and must be part of the analysis.
Technical analysis is another arrow to your quiver, and it answers the timing question a lot better than many other ways of viewing stocks. I believe it would be a shame to not use it.
Join Babylon Burns today and get all of the following:
All of the research reports I’ve already published.
Weekly or twice weekly reports on the best opportunities for investors.
The web application with the live portfolio.
Trade alerts every time I add to or cut a position.
Sizing, stop losses, everything about how I run my portfolio
more awesome features being added every week.
Babylon Burns is $399 a year or $100 a month, and every member gets everything: every pick with its size, stop and exit, plus the web app with the live portfolio, trade alerts by email, monthly tear sheets and the Studio charting tool. Annual works out to about $1.10 a day, a third of what twelve monthly payments cost. Substack gives you seven days to read everything and take your money back.